Immigrants from Trinidad and Tobago vs Immigrants from Netherlands Married-Couple Family Poverty
COMPARE
Immigrants from Trinidad and Tobago
Immigrants from Netherlands
Married-Couple Family Poverty
Married-Couple Family Poverty Comparison
Immigrants from Trinidad and Tobago
Immigrants from Netherlands
6.4%
MARRIED-COUPLE FAMILY POVERTY
0.1/ 100
METRIC RATING
278th/ 347
METRIC RANK
4.3%
MARRIED-COUPLE FAMILY POVERTY
99.7/ 100
METRIC RATING
57th/ 347
METRIC RANK
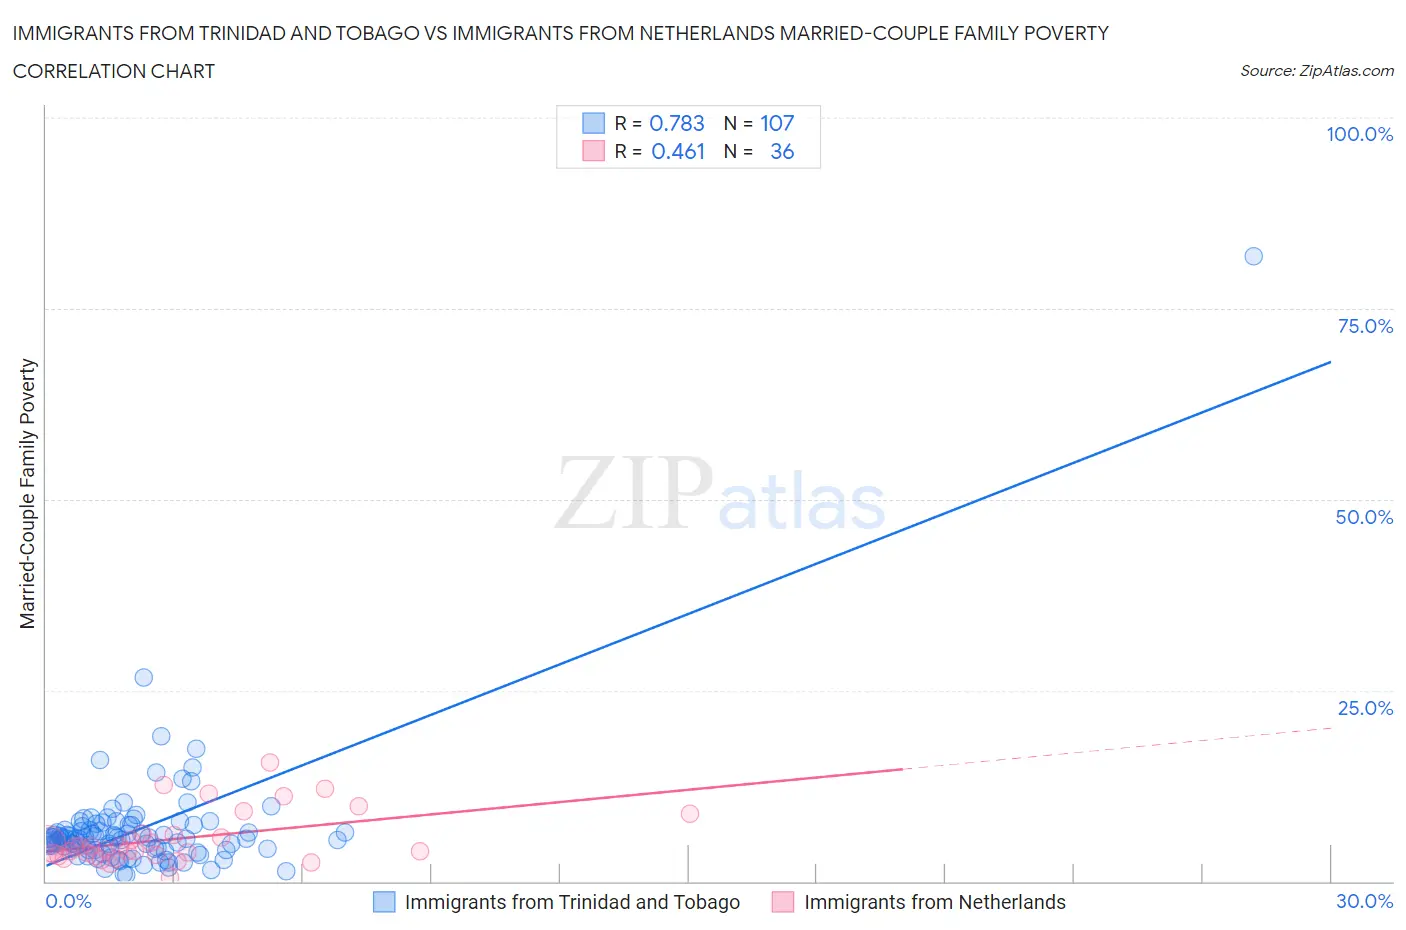
Immigrants from Trinidad and Tobago vs Immigrants from Netherlands Married-Couple Family Poverty Correlation Chart
The statistical analysis conducted on geographies consisting of 222,433,461 people shows a strong positive correlation between the proportion of Immigrants from Trinidad and Tobago and poverty level among married-couple families in the United States with a correlation coefficient (R) of 0.783 and weighted average of 6.4%. Similarly, the statistical analysis conducted on geographies consisting of 236,404,410 people shows a moderate positive correlation between the proportion of Immigrants from Netherlands and poverty level among married-couple families in the United States with a correlation coefficient (R) of 0.461 and weighted average of 4.3%, a difference of 46.4%.
Married-Couple Family Poverty Correlation Summary
| Measurement | Immigrants from Trinidad and Tobago | Immigrants from Netherlands |
| Minimum | 0.88% | 0.44% |
| Maximum | 81.8% | 15.6% |
| Range | 80.9% | 15.2% |
| Mean | 6.9% | 5.5% |
| Median | 5.6% | 4.3% |
| Interquartile 25% (IQ1) | 4.1% | 3.4% |
| Interquartile 75% (IQ3) | 7.4% | 6.2% |
| Interquartile Range (IQR) | 3.2% | 2.8% |
| Standard Deviation (Sample) | 8.2% | 3.5% |
| Standard Deviation (Population) | 8.2% | 3.4% |
Similar Demographics by Married-Couple Family Poverty
Demographics Similar to Immigrants from Trinidad and Tobago by Married-Couple Family Poverty
In terms of married-couple family poverty, the demographic groups most similar to Immigrants from Trinidad and Tobago are Houma (6.4%, a difference of 0.25%), West Indian (6.4%, a difference of 0.29%), Indonesian (6.3%, a difference of 0.48%), Yaqui (6.3%, a difference of 0.62%), and Mexican American Indian (6.4%, a difference of 0.80%).
| Demographics | Rating | Rank | Married-Couple Family Poverty |
| Immigrants | Bahamas | 0.1 /100 | #271 | Tragic 6.2% |
| Trinidadians and Tobagonians | 0.1 /100 | #272 | Tragic 6.2% |
| Colville | 0.1 /100 | #273 | Tragic 6.3% |
| Barbadians | 0.1 /100 | #274 | Tragic 6.3% |
| Choctaw | 0.1 /100 | #275 | Tragic 6.3% |
| Yaqui | 0.1 /100 | #276 | Tragic 6.3% |
| Indonesians | 0.1 /100 | #277 | Tragic 6.3% |
| Immigrants | Trinidad and Tobago | 0.1 /100 | #278 | Tragic 6.4% |
| Houma | 0.0 /100 | #279 | Tragic 6.4% |
| West Indians | 0.0 /100 | #280 | Tragic 6.4% |
| Mexican American Indians | 0.0 /100 | #281 | Tragic 6.4% |
| Seminole | 0.0 /100 | #282 | Tragic 6.4% |
| Ute | 0.0 /100 | #283 | Tragic 6.4% |
| Dutch West Indians | 0.0 /100 | #284 | Tragic 6.4% |
| Blacks/African Americans | 0.0 /100 | #285 | Tragic 6.5% |
Demographics Similar to Immigrants from Netherlands by Married-Couple Family Poverty
In terms of married-couple family poverty, the demographic groups most similar to Immigrants from Netherlands are Immigrants from Zimbabwe (4.3%, a difference of 0.0%), Czechoslovakian (4.4%, a difference of 0.090%), French (4.3%, a difference of 0.16%), Austrian (4.3%, a difference of 0.18%), and Welsh (4.3%, a difference of 0.45%).
| Demographics | Rating | Rank | Married-Couple Family Poverty |
| Burmese | 99.7 /100 | #50 | Exceptional 4.3% |
| Immigrants | Lithuania | 99.7 /100 | #51 | Exceptional 4.3% |
| Russians | 99.7 /100 | #52 | Exceptional 4.3% |
| Welsh | 99.7 /100 | #53 | Exceptional 4.3% |
| Austrians | 99.7 /100 | #54 | Exceptional 4.3% |
| French | 99.7 /100 | #55 | Exceptional 4.3% |
| Immigrants | Zimbabwe | 99.7 /100 | #56 | Exceptional 4.3% |
| Immigrants | Netherlands | 99.7 /100 | #57 | Exceptional 4.3% |
| Czechoslovakians | 99.7 /100 | #58 | Exceptional 4.4% |
| Immigrants | Sweden | 99.6 /100 | #59 | Exceptional 4.4% |
| Tlingit-Haida | 99.6 /100 | #60 | Exceptional 4.4% |
| Okinawans | 99.6 /100 | #61 | Exceptional 4.4% |
| Immigrants | Australia | 99.6 /100 | #62 | Exceptional 4.4% |
| Immigrants | Sri Lanka | 99.6 /100 | #63 | Exceptional 4.4% |
| Immigrants | Bulgaria | 99.5 /100 | #64 | Exceptional 4.4% |