Immigrants from Dominica vs Immigrants from Netherlands Married-Couple Family Poverty
COMPARE
Immigrants from Dominica
Immigrants from Netherlands
Married-Couple Family Poverty
Married-Couple Family Poverty Comparison
Immigrants from Dominica
Immigrants from Netherlands
7.1%
MARRIED-COUPLE FAMILY POVERTY
0.0/ 100
METRIC RATING
311th/ 347
METRIC RANK
4.3%
MARRIED-COUPLE FAMILY POVERTY
99.7/ 100
METRIC RATING
57th/ 347
METRIC RANK
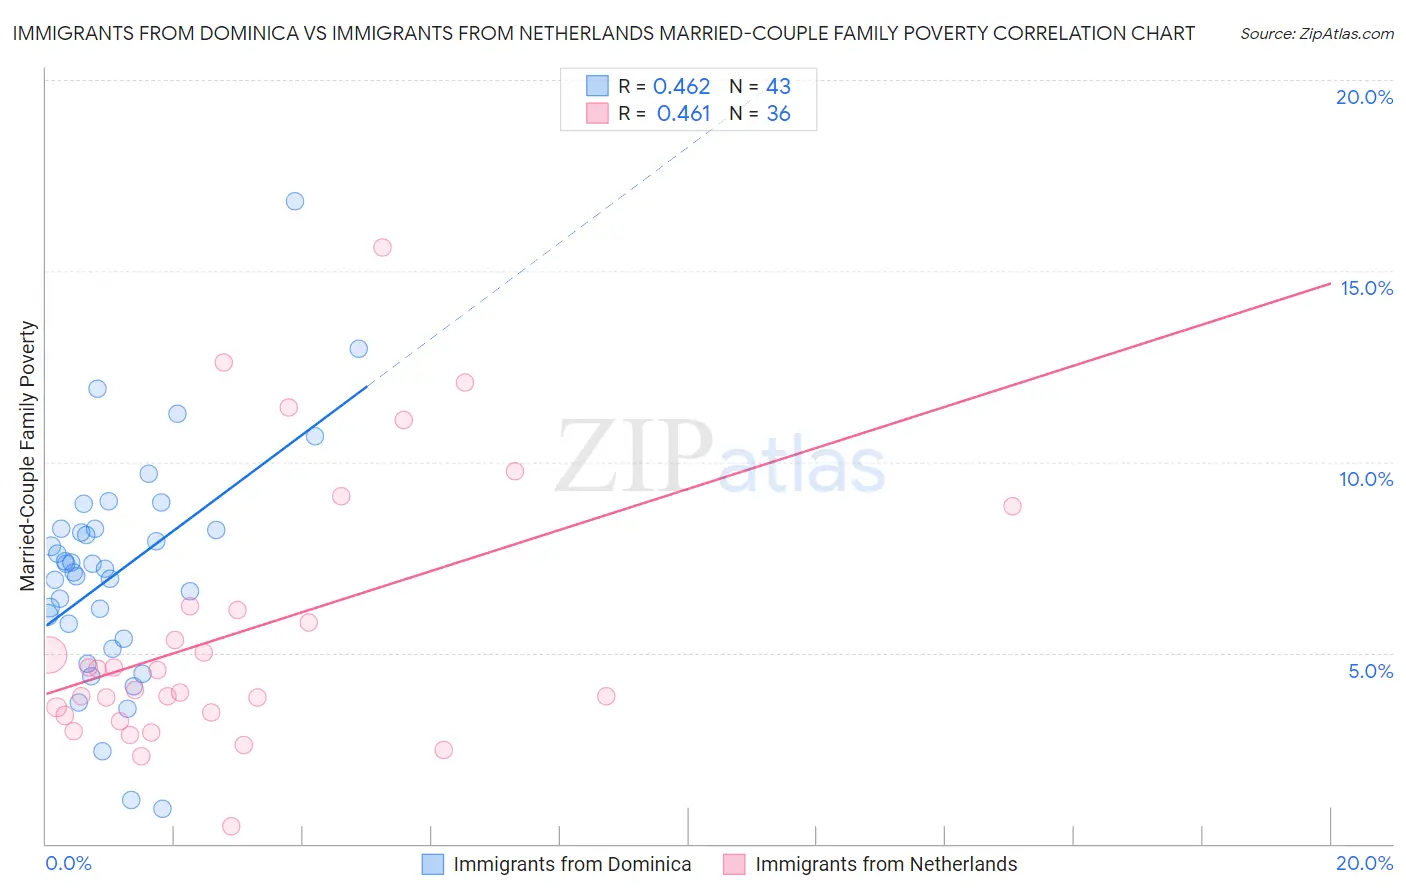
Immigrants from Dominica vs Immigrants from Netherlands Married-Couple Family Poverty Correlation Chart
The statistical analysis conducted on geographies consisting of 83,635,661 people shows a moderate positive correlation between the proportion of Immigrants from Dominica and poverty level among married-couple families in the United States with a correlation coefficient (R) of 0.462 and weighted average of 7.1%. Similarly, the statistical analysis conducted on geographies consisting of 236,404,410 people shows a moderate positive correlation between the proportion of Immigrants from Netherlands and poverty level among married-couple families in the United States with a correlation coefficient (R) of 0.461 and weighted average of 4.3%, a difference of 63.3%.
Married-Couple Family Poverty Correlation Summary
| Measurement | Immigrants from Dominica | Immigrants from Netherlands |
| Minimum | 0.91% | 0.44% |
| Maximum | 16.8% | 15.6% |
| Range | 15.9% | 15.2% |
| Mean | 7.1% | 5.5% |
| Median | 7.2% | 4.3% |
| Interquartile 25% (IQ1) | 5.4% | 3.4% |
| Interquartile 75% (IQ3) | 8.3% | 6.2% |
| Interquartile Range (IQR) | 2.9% | 2.8% |
| Standard Deviation (Sample) | 3.0% | 3.5% |
| Standard Deviation (Population) | 2.9% | 3.4% |
Similar Demographics by Married-Couple Family Poverty
Demographics Similar to Immigrants from Dominica by Married-Couple Family Poverty
In terms of married-couple family poverty, the demographic groups most similar to Immigrants from Dominica are Immigrants from Armenia (7.1%, a difference of 0.0%), Immigrants from Nicaragua (7.1%, a difference of 0.050%), Hopi (7.1%, a difference of 0.080%), Immigrants from St. Vincent and the Grenadines (7.1%, a difference of 0.11%), and British West Indian (7.1%, a difference of 0.41%).
| Demographics | Rating | Rank | Married-Couple Family Poverty |
| Cubans | 0.0 /100 | #304 | Tragic 6.8% |
| Haitians | 0.0 /100 | #305 | Tragic 6.8% |
| Immigrants | Haiti | 0.0 /100 | #306 | Tragic 7.0% |
| Guatemalans | 0.0 /100 | #307 | Tragic 7.0% |
| Spanish American Indians | 0.0 /100 | #308 | Tragic 7.1% |
| Hopi | 0.0 /100 | #309 | Tragic 7.1% |
| Immigrants | Nicaragua | 0.0 /100 | #310 | Tragic 7.1% |
| Immigrants | Dominica | 0.0 /100 | #311 | Tragic 7.1% |
| Immigrants | Armenia | 0.0 /100 | #312 | Tragic 7.1% |
| Immigrants | St. Vincent and the Grenadines | 0.0 /100 | #313 | Tragic 7.1% |
| British West Indians | 0.0 /100 | #314 | Tragic 7.1% |
| Inupiat | 0.0 /100 | #315 | Tragic 7.1% |
| Hondurans | 0.0 /100 | #316 | Tragic 7.2% |
| Mexicans | 0.0 /100 | #317 | Tragic 7.2% |
| Immigrants | Guatemala | 0.0 /100 | #318 | Tragic 7.2% |
Demographics Similar to Immigrants from Netherlands by Married-Couple Family Poverty
In terms of married-couple family poverty, the demographic groups most similar to Immigrants from Netherlands are Immigrants from Zimbabwe (4.3%, a difference of 0.0%), Czechoslovakian (4.4%, a difference of 0.090%), French (4.3%, a difference of 0.16%), Austrian (4.3%, a difference of 0.18%), and Welsh (4.3%, a difference of 0.45%).
| Demographics | Rating | Rank | Married-Couple Family Poverty |
| Burmese | 99.7 /100 | #50 | Exceptional 4.3% |
| Immigrants | Lithuania | 99.7 /100 | #51 | Exceptional 4.3% |
| Russians | 99.7 /100 | #52 | Exceptional 4.3% |
| Welsh | 99.7 /100 | #53 | Exceptional 4.3% |
| Austrians | 99.7 /100 | #54 | Exceptional 4.3% |
| French | 99.7 /100 | #55 | Exceptional 4.3% |
| Immigrants | Zimbabwe | 99.7 /100 | #56 | Exceptional 4.3% |
| Immigrants | Netherlands | 99.7 /100 | #57 | Exceptional 4.3% |
| Czechoslovakians | 99.7 /100 | #58 | Exceptional 4.4% |
| Immigrants | Sweden | 99.6 /100 | #59 | Exceptional 4.4% |
| Tlingit-Haida | 99.6 /100 | #60 | Exceptional 4.4% |
| Okinawans | 99.6 /100 | #61 | Exceptional 4.4% |
| Immigrants | Australia | 99.6 /100 | #62 | Exceptional 4.4% |
| Immigrants | Sri Lanka | 99.6 /100 | #63 | Exceptional 4.4% |
| Immigrants | Bulgaria | 99.5 /100 | #64 | Exceptional 4.4% |