Immigrants from Trinidad and Tobago vs Immigrants from Latvia Married-Couple Family Poverty
COMPARE
Immigrants from Trinidad and Tobago
Immigrants from Latvia
Married-Couple Family Poverty
Married-Couple Family Poverty Comparison
Immigrants from Trinidad and Tobago
Immigrants from Latvia
6.4%
MARRIED-COUPLE FAMILY POVERTY
0.1/ 100
METRIC RATING
278th/ 347
METRIC RANK
4.5%
MARRIED-COUPLE FAMILY POVERTY
99.1/ 100
METRIC RATING
77th/ 347
METRIC RANK
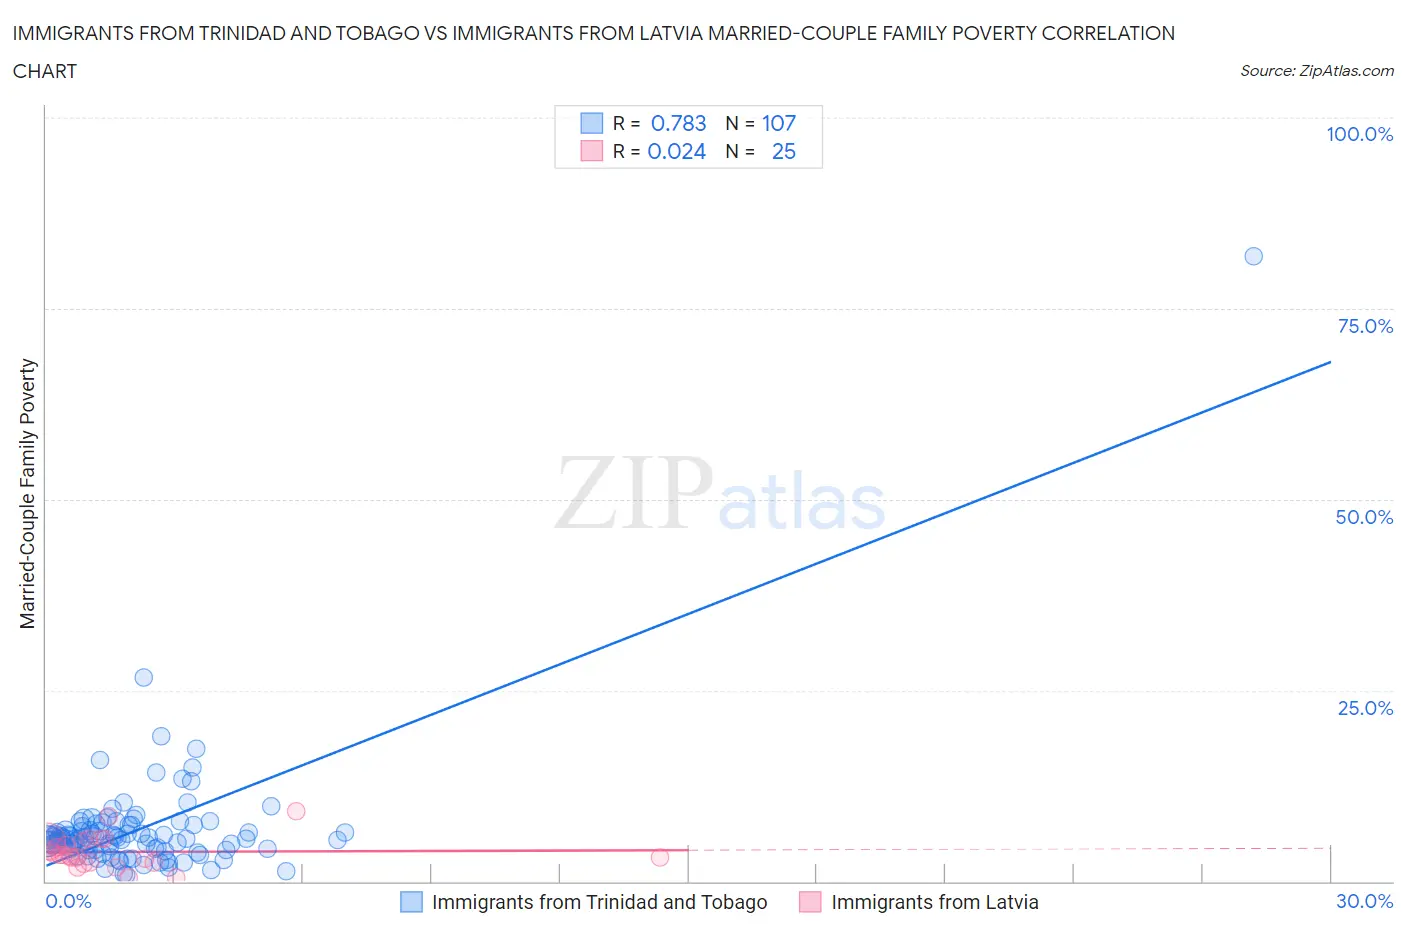
Immigrants from Trinidad and Tobago vs Immigrants from Latvia Married-Couple Family Poverty Correlation Chart
The statistical analysis conducted on geographies consisting of 222,433,461 people shows a strong positive correlation between the proportion of Immigrants from Trinidad and Tobago and poverty level among married-couple families in the United States with a correlation coefficient (R) of 0.783 and weighted average of 6.4%. Similarly, the statistical analysis conducted on geographies consisting of 113,402,178 people shows no correlation between the proportion of Immigrants from Latvia and poverty level among married-couple families in the United States with a correlation coefficient (R) of 0.024 and weighted average of 4.5%, a difference of 41.1%.
Married-Couple Family Poverty Correlation Summary
| Measurement | Immigrants from Trinidad and Tobago | Immigrants from Latvia |
| Minimum | 0.88% | 0.50% |
| Maximum | 81.8% | 9.1% |
| Range | 80.9% | 8.6% |
| Mean | 6.9% | 3.8% |
| Median | 5.6% | 3.5% |
| Interquartile 25% (IQ1) | 4.1% | 2.5% |
| Interquartile 75% (IQ3) | 7.4% | 5.3% |
| Interquartile Range (IQR) | 3.2% | 2.8% |
| Standard Deviation (Sample) | 8.2% | 2.1% |
| Standard Deviation (Population) | 8.2% | 2.0% |
Similar Demographics by Married-Couple Family Poverty
Demographics Similar to Immigrants from Trinidad and Tobago by Married-Couple Family Poverty
In terms of married-couple family poverty, the demographic groups most similar to Immigrants from Trinidad and Tobago are Houma (6.4%, a difference of 0.25%), West Indian (6.4%, a difference of 0.29%), Indonesian (6.3%, a difference of 0.48%), Yaqui (6.3%, a difference of 0.62%), and Mexican American Indian (6.4%, a difference of 0.80%).
| Demographics | Rating | Rank | Married-Couple Family Poverty |
| Immigrants | Bahamas | 0.1 /100 | #271 | Tragic 6.2% |
| Trinidadians and Tobagonians | 0.1 /100 | #272 | Tragic 6.2% |
| Colville | 0.1 /100 | #273 | Tragic 6.3% |
| Barbadians | 0.1 /100 | #274 | Tragic 6.3% |
| Choctaw | 0.1 /100 | #275 | Tragic 6.3% |
| Yaqui | 0.1 /100 | #276 | Tragic 6.3% |
| Indonesians | 0.1 /100 | #277 | Tragic 6.3% |
| Immigrants | Trinidad and Tobago | 0.1 /100 | #278 | Tragic 6.4% |
| Houma | 0.0 /100 | #279 | Tragic 6.4% |
| West Indians | 0.0 /100 | #280 | Tragic 6.4% |
| Mexican American Indians | 0.0 /100 | #281 | Tragic 6.4% |
| Seminole | 0.0 /100 | #282 | Tragic 6.4% |
| Ute | 0.0 /100 | #283 | Tragic 6.4% |
| Dutch West Indians | 0.0 /100 | #284 | Tragic 6.4% |
| Blacks/African Americans | 0.0 /100 | #285 | Tragic 6.5% |
Demographics Similar to Immigrants from Latvia by Married-Couple Family Poverty
In terms of married-couple family poverty, the demographic groups most similar to Immigrants from Latvia are Scotch-Irish (4.5%, a difference of 0.080%), Immigrants from South Africa (4.5%, a difference of 0.17%), Cambodian (4.5%, a difference of 0.28%), Immigrants from Iran (4.5%, a difference of 0.31%), and Icelander (4.5%, a difference of 0.38%).
| Demographics | Rating | Rank | Married-Couple Family Poverty |
| Immigrants | Korea | 99.4 /100 | #70 | Exceptional 4.5% |
| Immigrants | North America | 99.3 /100 | #71 | Exceptional 4.5% |
| Immigrants | England | 99.3 /100 | #72 | Exceptional 4.5% |
| Ukrainians | 99.2 /100 | #73 | Exceptional 4.5% |
| Immigrants | Austria | 99.2 /100 | #74 | Exceptional 4.5% |
| Cambodians | 99.2 /100 | #75 | Exceptional 4.5% |
| Immigrants | South Africa | 99.1 /100 | #76 | Exceptional 4.5% |
| Immigrants | Latvia | 99.1 /100 | #77 | Exceptional 4.5% |
| Scotch-Irish | 99.1 /100 | #78 | Exceptional 4.5% |
| Immigrants | Iran | 99.0 /100 | #79 | Exceptional 4.5% |
| Icelanders | 99.0 /100 | #80 | Exceptional 4.5% |
| Immigrants | Greece | 98.9 /100 | #81 | Exceptional 4.5% |
| Canadians | 98.8 /100 | #82 | Exceptional 4.5% |
| Immigrants | Denmark | 98.8 /100 | #83 | Exceptional 4.6% |
| Immigrants | Croatia | 98.7 /100 | #84 | Exceptional 4.6% |