Immigrants from Uganda vs Immigrants from Netherlands Married-Couple Family Poverty
COMPARE
Immigrants from Uganda
Immigrants from Netherlands
Married-Couple Family Poverty
Married-Couple Family Poverty Comparison
Immigrants from Uganda
Immigrants from Netherlands
5.2%
MARRIED-COUPLE FAMILY POVERTY
54.9/ 100
METRIC RATING
168th/ 347
METRIC RANK
4.3%
MARRIED-COUPLE FAMILY POVERTY
99.7/ 100
METRIC RATING
57th/ 347
METRIC RANK
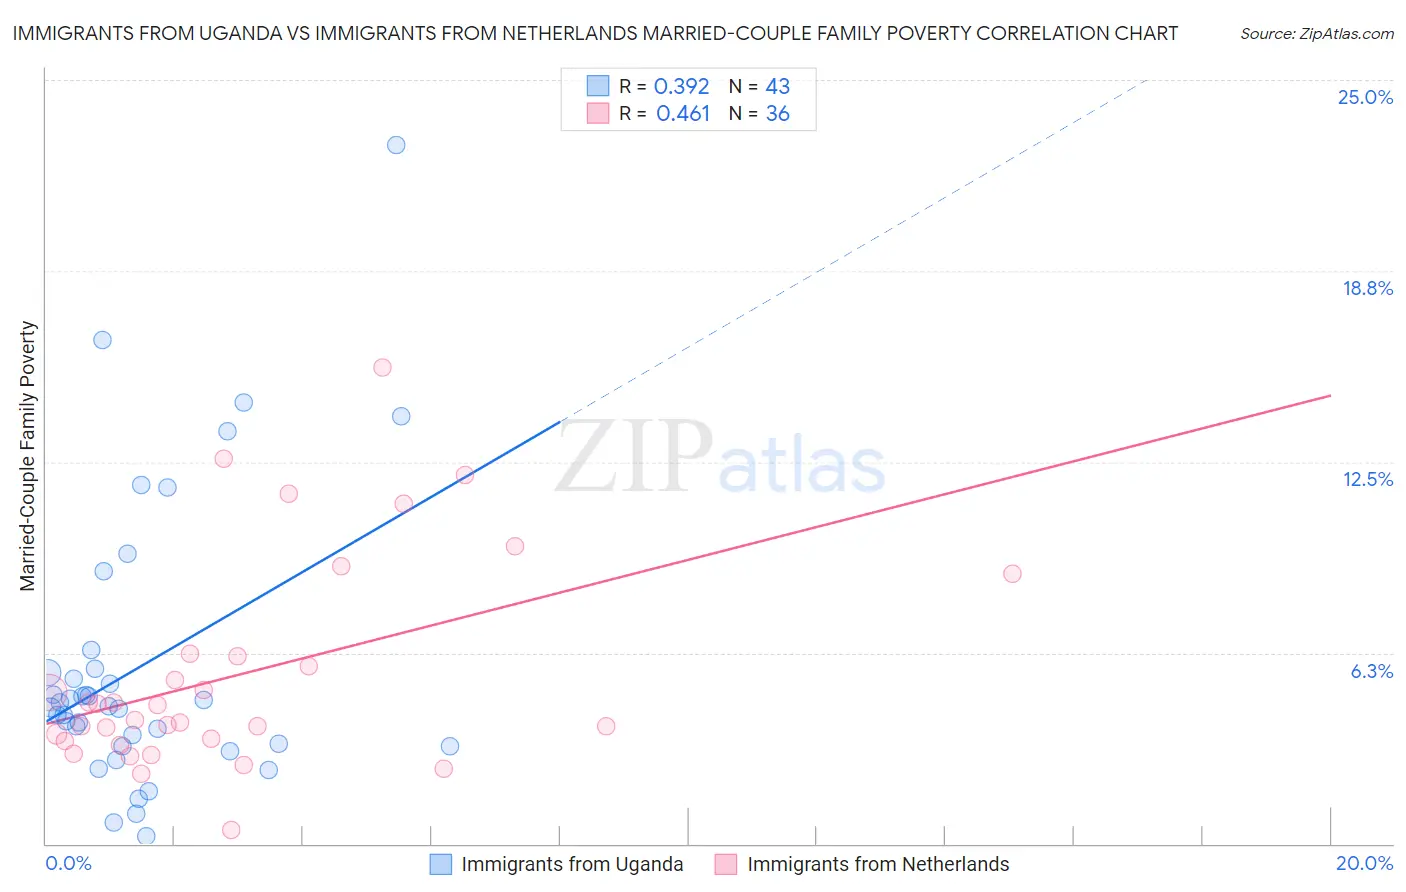
Immigrants from Uganda vs Immigrants from Netherlands Married-Couple Family Poverty Correlation Chart
The statistical analysis conducted on geographies consisting of 125,662,794 people shows a mild positive correlation between the proportion of Immigrants from Uganda and poverty level among married-couple families in the United States with a correlation coefficient (R) of 0.392 and weighted average of 5.2%. Similarly, the statistical analysis conducted on geographies consisting of 236,404,410 people shows a moderate positive correlation between the proportion of Immigrants from Netherlands and poverty level among married-couple families in the United States with a correlation coefficient (R) of 0.461 and weighted average of 4.3%, a difference of 19.4%.
Married-Couple Family Poverty Correlation Summary
| Measurement | Immigrants from Uganda | Immigrants from Netherlands |
| Minimum | 0.25% | 0.44% |
| Maximum | 22.9% | 15.6% |
| Range | 22.6% | 15.2% |
| Mean | 5.8% | 5.5% |
| Median | 4.5% | 4.3% |
| Interquartile 25% (IQ1) | 3.2% | 3.4% |
| Interquartile 75% (IQ3) | 5.7% | 6.2% |
| Interquartile Range (IQR) | 2.5% | 2.8% |
| Standard Deviation (Sample) | 4.7% | 3.5% |
| Standard Deviation (Population) | 4.6% | 3.4% |
Similar Demographics by Married-Couple Family Poverty
Demographics Similar to Immigrants from Uganda by Married-Couple Family Poverty
In terms of married-couple family poverty, the demographic groups most similar to Immigrants from Uganda are Ottawa (5.2%, a difference of 0.040%), Immigrants from Argentina (5.2%, a difference of 0.060%), Bermudan (5.2%, a difference of 0.23%), Immigrants from Northern Africa (5.2%, a difference of 0.41%), and Alsatian (5.2%, a difference of 0.43%).
| Demographics | Rating | Rank | Married-Couple Family Poverty |
| Ethiopians | 68.1 /100 | #161 | Good 5.1% |
| Immigrants | Jordan | 66.5 /100 | #162 | Good 5.1% |
| Sierra Leoneans | 64.1 /100 | #163 | Good 5.1% |
| Hawaiians | 62.3 /100 | #164 | Good 5.1% |
| Immigrants | Malaysia | 62.2 /100 | #165 | Good 5.1% |
| Paraguayans | 61.5 /100 | #166 | Good 5.1% |
| Costa Ricans | 61.5 /100 | #167 | Good 5.1% |
| Immigrants | Uganda | 54.9 /100 | #168 | Average 5.2% |
| Ottawa | 54.5 /100 | #169 | Average 5.2% |
| Immigrants | Argentina | 54.4 /100 | #170 | Average 5.2% |
| Bermudans | 52.9 /100 | #171 | Average 5.2% |
| Immigrants | Northern Africa | 51.3 /100 | #172 | Average 5.2% |
| Alsatians | 51.2 /100 | #173 | Average 5.2% |
| Immigrants | Eastern Africa | 50.0 /100 | #174 | Average 5.2% |
| Marshallese | 47.9 /100 | #175 | Average 5.2% |
Demographics Similar to Immigrants from Netherlands by Married-Couple Family Poverty
In terms of married-couple family poverty, the demographic groups most similar to Immigrants from Netherlands are Immigrants from Zimbabwe (4.3%, a difference of 0.0%), Czechoslovakian (4.4%, a difference of 0.090%), French (4.3%, a difference of 0.16%), Austrian (4.3%, a difference of 0.18%), and Welsh (4.3%, a difference of 0.45%).
| Demographics | Rating | Rank | Married-Couple Family Poverty |
| Burmese | 99.7 /100 | #50 | Exceptional 4.3% |
| Immigrants | Lithuania | 99.7 /100 | #51 | Exceptional 4.3% |
| Russians | 99.7 /100 | #52 | Exceptional 4.3% |
| Welsh | 99.7 /100 | #53 | Exceptional 4.3% |
| Austrians | 99.7 /100 | #54 | Exceptional 4.3% |
| French | 99.7 /100 | #55 | Exceptional 4.3% |
| Immigrants | Zimbabwe | 99.7 /100 | #56 | Exceptional 4.3% |
| Immigrants | Netherlands | 99.7 /100 | #57 | Exceptional 4.3% |
| Czechoslovakians | 99.7 /100 | #58 | Exceptional 4.4% |
| Immigrants | Sweden | 99.6 /100 | #59 | Exceptional 4.4% |
| Tlingit-Haida | 99.6 /100 | #60 | Exceptional 4.4% |
| Okinawans | 99.6 /100 | #61 | Exceptional 4.4% |
| Immigrants | Australia | 99.6 /100 | #62 | Exceptional 4.4% |
| Immigrants | Sri Lanka | 99.6 /100 | #63 | Exceptional 4.4% |
| Immigrants | Bulgaria | 99.5 /100 | #64 | Exceptional 4.4% |