Immigrants from Switzerland vs Immigrants from Netherlands Married-Couple Family Poverty
COMPARE
Immigrants from Switzerland
Immigrants from Netherlands
Married-Couple Family Poverty
Married-Couple Family Poverty Comparison
Immigrants from Switzerland
Immigrants from Netherlands
4.6%
MARRIED-COUPLE FAMILY POVERTY
98.5/ 100
METRIC RATING
90th/ 347
METRIC RANK
4.3%
MARRIED-COUPLE FAMILY POVERTY
99.7/ 100
METRIC RATING
57th/ 347
METRIC RANK
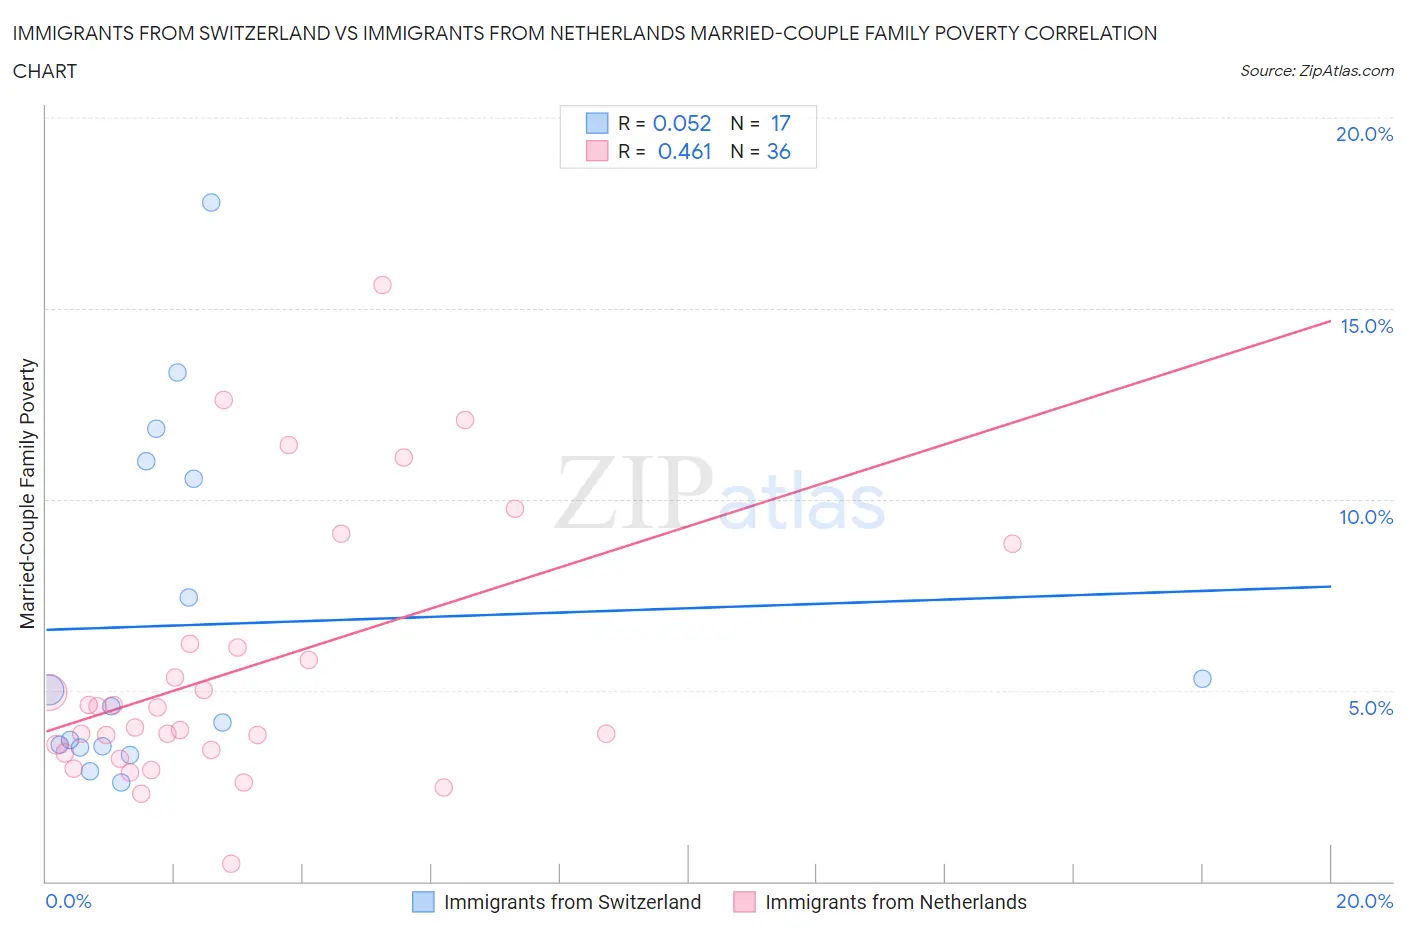
Immigrants from Switzerland vs Immigrants from Netherlands Married-Couple Family Poverty Correlation Chart
The statistical analysis conducted on geographies consisting of 147,526,625 people shows a slight positive correlation between the proportion of Immigrants from Switzerland and poverty level among married-couple families in the United States with a correlation coefficient (R) of 0.052 and weighted average of 4.6%. Similarly, the statistical analysis conducted on geographies consisting of 236,404,410 people shows a moderate positive correlation between the proportion of Immigrants from Netherlands and poverty level among married-couple families in the United States with a correlation coefficient (R) of 0.461 and weighted average of 4.3%, a difference of 5.5%.
Married-Couple Family Poverty Correlation Summary
| Measurement | Immigrants from Switzerland | Immigrants from Netherlands |
| Minimum | 2.6% | 0.44% |
| Maximum | 17.8% | 15.6% |
| Range | 15.2% | 15.2% |
| Mean | 6.7% | 5.5% |
| Median | 4.6% | 4.3% |
| Interquartile 25% (IQ1) | 3.5% | 3.4% |
| Interquartile 75% (IQ3) | 10.8% | 6.2% |
| Interquartile Range (IQR) | 7.3% | 2.8% |
| Standard Deviation (Sample) | 4.5% | 3.5% |
| Standard Deviation (Population) | 4.4% | 3.4% |
Similar Demographics by Married-Couple Family Poverty
Demographics Similar to Immigrants from Switzerland by Married-Couple Family Poverty
In terms of married-couple family poverty, the demographic groups most similar to Immigrants from Switzerland are Basque (4.6%, a difference of 0.040%), Immigrants from Czechoslovakia (4.6%, a difference of 0.070%), Immigrants from Norway (4.6%, a difference of 0.11%), Bolivian (4.6%, a difference of 0.18%), and Immigrants from North Macedonia (4.6%, a difference of 0.28%).
| Demographics | Rating | Rank | Married-Couple Family Poverty |
| Immigrants | Denmark | 98.8 /100 | #83 | Exceptional 4.6% |
| Immigrants | Croatia | 98.7 /100 | #84 | Exceptional 4.6% |
| South Africans | 98.7 /100 | #85 | Exceptional 4.6% |
| Immigrants | Turkey | 98.6 /100 | #86 | Exceptional 4.6% |
| Immigrants | North Macedonia | 98.6 /100 | #87 | Exceptional 4.6% |
| Bolivians | 98.6 /100 | #88 | Exceptional 4.6% |
| Immigrants | Czechoslovakia | 98.5 /100 | #89 | Exceptional 4.6% |
| Immigrants | Switzerland | 98.5 /100 | #90 | Exceptional 4.6% |
| Basques | 98.5 /100 | #91 | Exceptional 4.6% |
| Immigrants | Norway | 98.4 /100 | #92 | Exceptional 4.6% |
| Koreans | 98.3 /100 | #93 | Exceptional 4.6% |
| Immigrants | Italy | 98.3 /100 | #94 | Exceptional 4.6% |
| Portuguese | 98.3 /100 | #95 | Exceptional 4.6% |
| Immigrants | Poland | 98.3 /100 | #96 | Exceptional 4.6% |
| Immigrants | Belgium | 98.2 /100 | #97 | Exceptional 4.6% |
Demographics Similar to Immigrants from Netherlands by Married-Couple Family Poverty
In terms of married-couple family poverty, the demographic groups most similar to Immigrants from Netherlands are Immigrants from Zimbabwe (4.3%, a difference of 0.0%), Czechoslovakian (4.4%, a difference of 0.090%), French (4.3%, a difference of 0.16%), Austrian (4.3%, a difference of 0.18%), and Welsh (4.3%, a difference of 0.45%).
| Demographics | Rating | Rank | Married-Couple Family Poverty |
| Burmese | 99.7 /100 | #50 | Exceptional 4.3% |
| Immigrants | Lithuania | 99.7 /100 | #51 | Exceptional 4.3% |
| Russians | 99.7 /100 | #52 | Exceptional 4.3% |
| Welsh | 99.7 /100 | #53 | Exceptional 4.3% |
| Austrians | 99.7 /100 | #54 | Exceptional 4.3% |
| French | 99.7 /100 | #55 | Exceptional 4.3% |
| Immigrants | Zimbabwe | 99.7 /100 | #56 | Exceptional 4.3% |
| Immigrants | Netherlands | 99.7 /100 | #57 | Exceptional 4.3% |
| Czechoslovakians | 99.7 /100 | #58 | Exceptional 4.4% |
| Immigrants | Sweden | 99.6 /100 | #59 | Exceptional 4.4% |
| Tlingit-Haida | 99.6 /100 | #60 | Exceptional 4.4% |
| Okinawans | 99.6 /100 | #61 | Exceptional 4.4% |
| Immigrants | Australia | 99.6 /100 | #62 | Exceptional 4.4% |
| Immigrants | Sri Lanka | 99.6 /100 | #63 | Exceptional 4.4% |
| Immigrants | Bulgaria | 99.5 /100 | #64 | Exceptional 4.4% |