Ecuadorian vs Immigrants from Netherlands Married-Couple Family Poverty
COMPARE
Ecuadorian
Immigrants from Netherlands
Married-Couple Family Poverty
Married-Couple Family Poverty Comparison
Ecuadorians
Immigrants from Netherlands
6.5%
MARRIED-COUPLE FAMILY POVERTY
0.0/ 100
METRIC RATING
287th/ 347
METRIC RANK
4.3%
MARRIED-COUPLE FAMILY POVERTY
99.7/ 100
METRIC RATING
57th/ 347
METRIC RANK
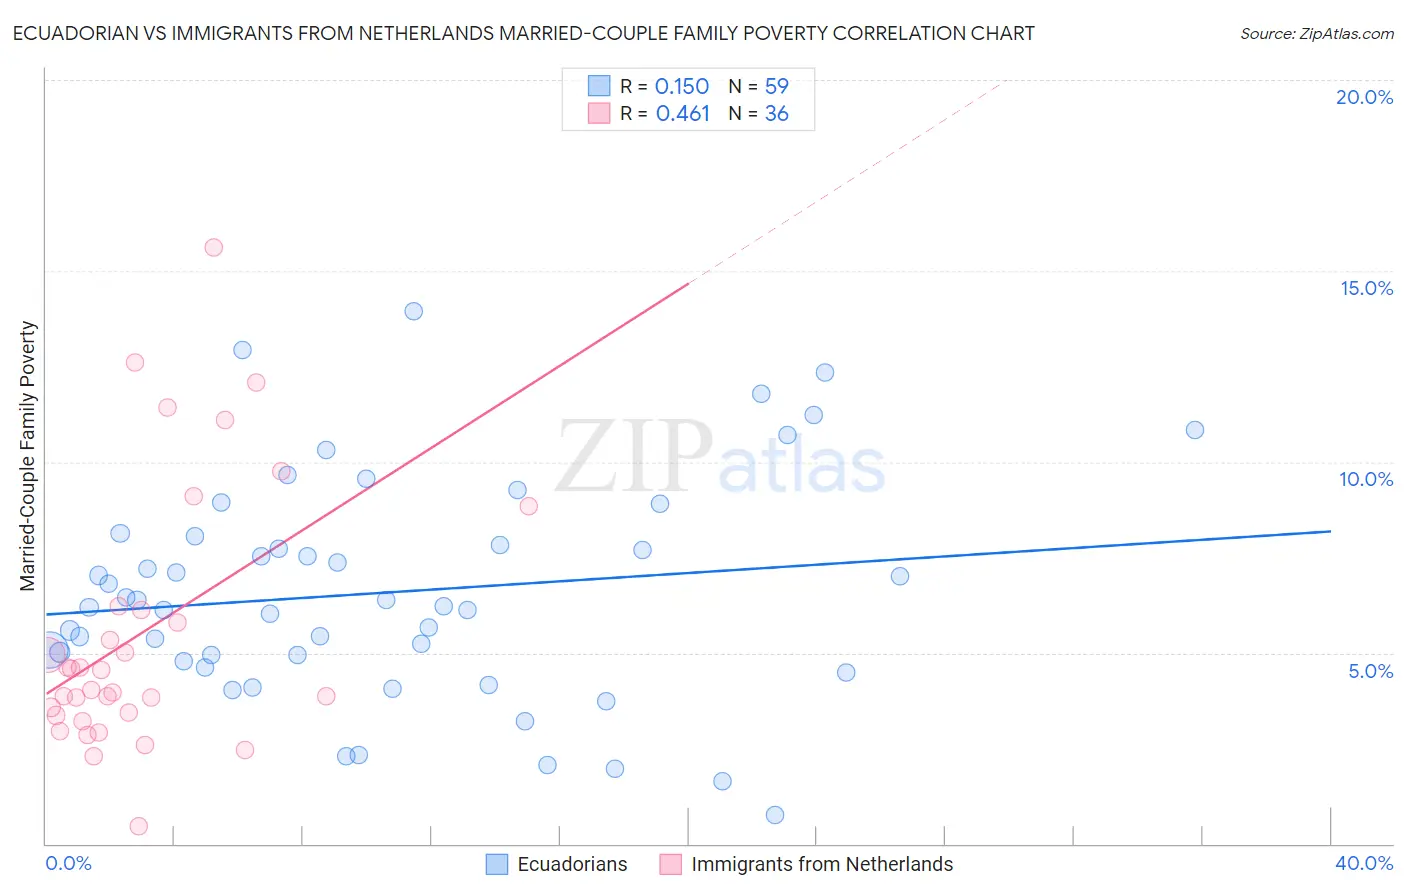
Ecuadorian vs Immigrants from Netherlands Married-Couple Family Poverty Correlation Chart
The statistical analysis conducted on geographies consisting of 315,566,767 people shows a poor positive correlation between the proportion of Ecuadorians and poverty level among married-couple families in the United States with a correlation coefficient (R) of 0.150 and weighted average of 6.5%. Similarly, the statistical analysis conducted on geographies consisting of 236,404,410 people shows a moderate positive correlation between the proportion of Immigrants from Netherlands and poverty level among married-couple families in the United States with a correlation coefficient (R) of 0.461 and weighted average of 4.3%, a difference of 49.7%.
Married-Couple Family Poverty Correlation Summary
| Measurement | Ecuadorian | Immigrants from Netherlands |
| Minimum | 0.76% | 0.44% |
| Maximum | 13.9% | 15.6% |
| Range | 13.2% | 15.2% |
| Mean | 6.6% | 5.5% |
| Median | 6.2% | 4.3% |
| Interquartile 25% (IQ1) | 4.8% | 3.4% |
| Interquartile 75% (IQ3) | 8.1% | 6.2% |
| Interquartile Range (IQR) | 3.3% | 2.8% |
| Standard Deviation (Sample) | 2.9% | 3.5% |
| Standard Deviation (Population) | 2.9% | 3.4% |
Similar Demographics by Married-Couple Family Poverty
Demographics Similar to Ecuadorians by Married-Couple Family Poverty
In terms of married-couple family poverty, the demographic groups most similar to Ecuadorians are Salvadoran (6.5%, a difference of 0.19%), Nepalese (6.5%, a difference of 0.36%), Guyanese (6.5%, a difference of 0.37%), Black/African American (6.5%, a difference of 0.47%), and Immigrants from Barbados (6.5%, a difference of 0.59%).
| Demographics | Rating | Rank | Married-Couple Family Poverty |
| West Indians | 0.0 /100 | #280 | Tragic 6.4% |
| Mexican American Indians | 0.0 /100 | #281 | Tragic 6.4% |
| Seminole | 0.0 /100 | #282 | Tragic 6.4% |
| Ute | 0.0 /100 | #283 | Tragic 6.4% |
| Dutch West Indians | 0.0 /100 | #284 | Tragic 6.4% |
| Blacks/African Americans | 0.0 /100 | #285 | Tragic 6.5% |
| Guyanese | 0.0 /100 | #286 | Tragic 6.5% |
| Ecuadorians | 0.0 /100 | #287 | Tragic 6.5% |
| Salvadorans | 0.0 /100 | #288 | Tragic 6.5% |
| Nepalese | 0.0 /100 | #289 | Tragic 6.5% |
| Immigrants | Barbados | 0.0 /100 | #290 | Tragic 6.5% |
| Belizeans | 0.0 /100 | #291 | Tragic 6.5% |
| Immigrants | Lebanon | 0.0 /100 | #292 | Tragic 6.6% |
| Arapaho | 0.0 /100 | #293 | Tragic 6.6% |
| Bahamians | 0.0 /100 | #294 | Tragic 6.6% |
Demographics Similar to Immigrants from Netherlands by Married-Couple Family Poverty
In terms of married-couple family poverty, the demographic groups most similar to Immigrants from Netherlands are Immigrants from Zimbabwe (4.3%, a difference of 0.0%), Czechoslovakian (4.4%, a difference of 0.090%), French (4.3%, a difference of 0.16%), Austrian (4.3%, a difference of 0.18%), and Welsh (4.3%, a difference of 0.45%).
| Demographics | Rating | Rank | Married-Couple Family Poverty |
| Burmese | 99.7 /100 | #50 | Exceptional 4.3% |
| Immigrants | Lithuania | 99.7 /100 | #51 | Exceptional 4.3% |
| Russians | 99.7 /100 | #52 | Exceptional 4.3% |
| Welsh | 99.7 /100 | #53 | Exceptional 4.3% |
| Austrians | 99.7 /100 | #54 | Exceptional 4.3% |
| French | 99.7 /100 | #55 | Exceptional 4.3% |
| Immigrants | Zimbabwe | 99.7 /100 | #56 | Exceptional 4.3% |
| Immigrants | Netherlands | 99.7 /100 | #57 | Exceptional 4.3% |
| Czechoslovakians | 99.7 /100 | #58 | Exceptional 4.4% |
| Immigrants | Sweden | 99.6 /100 | #59 | Exceptional 4.4% |
| Tlingit-Haida | 99.6 /100 | #60 | Exceptional 4.4% |
| Okinawans | 99.6 /100 | #61 | Exceptional 4.4% |
| Immigrants | Australia | 99.6 /100 | #62 | Exceptional 4.4% |
| Immigrants | Sri Lanka | 99.6 /100 | #63 | Exceptional 4.4% |
| Immigrants | Bulgaria | 99.5 /100 | #64 | Exceptional 4.4% |