Immigrants from Trinidad and Tobago vs Immigrants from Cuba Married-Couple Family Poverty
COMPARE
Immigrants from Trinidad and Tobago
Immigrants from Cuba
Married-Couple Family Poverty
Married-Couple Family Poverty Comparison
Immigrants from Trinidad and Tobago
Immigrants from Cuba
6.4%
MARRIED-COUPLE FAMILY POVERTY
0.1/ 100
METRIC RATING
278th/ 347
METRIC RANK
7.5%
MARRIED-COUPLE FAMILY POVERTY
0.0/ 100
METRIC RATING
325th/ 347
METRIC RANK
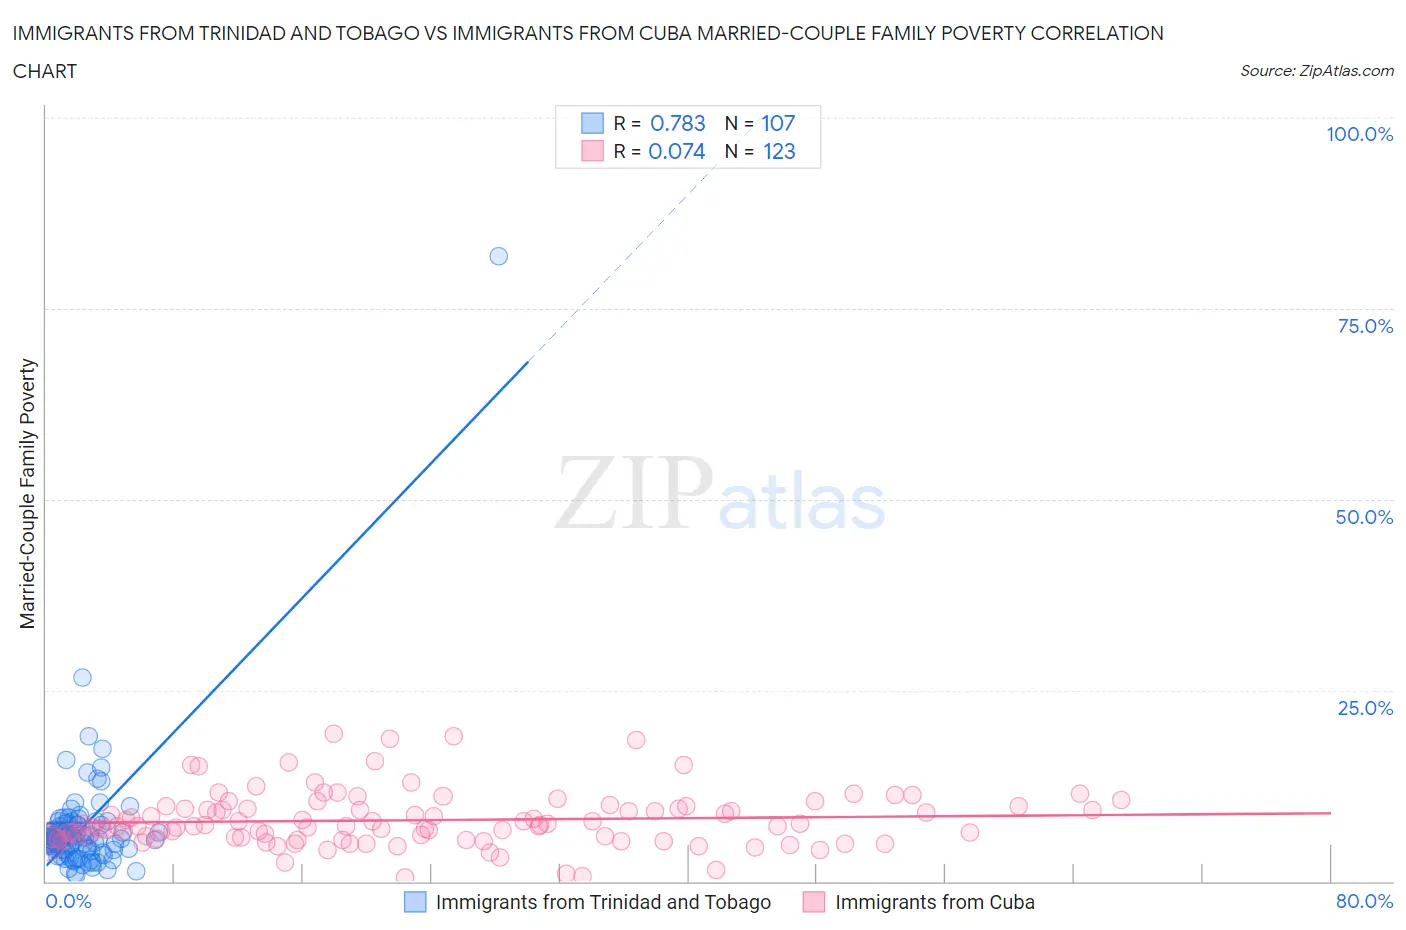
Immigrants from Trinidad and Tobago vs Immigrants from Cuba Married-Couple Family Poverty Correlation Chart
The statistical analysis conducted on geographies consisting of 222,433,461 people shows a strong positive correlation between the proportion of Immigrants from Trinidad and Tobago and poverty level among married-couple families in the United States with a correlation coefficient (R) of 0.783 and weighted average of 6.4%. Similarly, the statistical analysis conducted on geographies consisting of 324,285,168 people shows a slight positive correlation between the proportion of Immigrants from Cuba and poverty level among married-couple families in the United States with a correlation coefficient (R) of 0.074 and weighted average of 7.5%, a difference of 17.4%.
Married-Couple Family Poverty Correlation Summary
| Measurement | Immigrants from Trinidad and Tobago | Immigrants from Cuba |
| Minimum | 0.88% | 0.42% |
| Maximum | 81.8% | 19.2% |
| Range | 80.9% | 18.8% |
| Mean | 6.9% | 8.0% |
| Median | 5.6% | 7.3% |
| Interquartile 25% (IQ1) | 4.1% | 5.6% |
| Interquartile 75% (IQ3) | 7.4% | 9.6% |
| Interquartile Range (IQR) | 3.2% | 3.9% |
| Standard Deviation (Sample) | 8.2% | 3.6% |
| Standard Deviation (Population) | 8.2% | 3.6% |
Similar Demographics by Married-Couple Family Poverty
Demographics Similar to Immigrants from Trinidad and Tobago by Married-Couple Family Poverty
In terms of married-couple family poverty, the demographic groups most similar to Immigrants from Trinidad and Tobago are Houma (6.4%, a difference of 0.25%), West Indian (6.4%, a difference of 0.29%), Indonesian (6.3%, a difference of 0.48%), Yaqui (6.3%, a difference of 0.62%), and Mexican American Indian (6.4%, a difference of 0.80%).
| Demographics | Rating | Rank | Married-Couple Family Poverty |
| Immigrants | Bahamas | 0.1 /100 | #271 | Tragic 6.2% |
| Trinidadians and Tobagonians | 0.1 /100 | #272 | Tragic 6.2% |
| Colville | 0.1 /100 | #273 | Tragic 6.3% |
| Barbadians | 0.1 /100 | #274 | Tragic 6.3% |
| Choctaw | 0.1 /100 | #275 | Tragic 6.3% |
| Yaqui | 0.1 /100 | #276 | Tragic 6.3% |
| Indonesians | 0.1 /100 | #277 | Tragic 6.3% |
| Immigrants | Trinidad and Tobago | 0.1 /100 | #278 | Tragic 6.4% |
| Houma | 0.0 /100 | #279 | Tragic 6.4% |
| West Indians | 0.0 /100 | #280 | Tragic 6.4% |
| Mexican American Indians | 0.0 /100 | #281 | Tragic 6.4% |
| Seminole | 0.0 /100 | #282 | Tragic 6.4% |
| Ute | 0.0 /100 | #283 | Tragic 6.4% |
| Dutch West Indians | 0.0 /100 | #284 | Tragic 6.4% |
| Blacks/African Americans | 0.0 /100 | #285 | Tragic 6.5% |
Demographics Similar to Immigrants from Cuba by Married-Couple Family Poverty
In terms of married-couple family poverty, the demographic groups most similar to Immigrants from Cuba are Immigrants from Bangladesh (7.5%, a difference of 0.20%), Hispanic or Latino (7.5%, a difference of 0.20%), Immigrants from Central America (7.4%, a difference of 0.53%), Vietnamese (7.4%, a difference of 0.63%), and Immigrants from Mexico (7.6%, a difference of 1.4%).
| Demographics | Rating | Rank | Married-Couple Family Poverty |
| Immigrants | Guatemala | 0.0 /100 | #318 | Tragic 7.2% |
| Immigrants | Latin America | 0.0 /100 | #319 | Tragic 7.2% |
| Immigrants | Grenada | 0.0 /100 | #320 | Tragic 7.3% |
| Immigrants | Caribbean | 0.0 /100 | #321 | Tragic 7.3% |
| Immigrants | Honduras | 0.0 /100 | #322 | Tragic 7.3% |
| Vietnamese | 0.0 /100 | #323 | Tragic 7.4% |
| Immigrants | Central America | 0.0 /100 | #324 | Tragic 7.4% |
| Immigrants | Cuba | 0.0 /100 | #325 | Tragic 7.5% |
| Immigrants | Bangladesh | 0.0 /100 | #326 | Tragic 7.5% |
| Hispanics or Latinos | 0.0 /100 | #327 | Tragic 7.5% |
| Immigrants | Mexico | 0.0 /100 | #328 | Tragic 7.6% |
| Natives/Alaskans | 0.0 /100 | #329 | Tragic 8.2% |
| Paiute | 0.0 /100 | #330 | Tragic 8.3% |
| Central American Indians | 0.0 /100 | #331 | Tragic 8.3% |
| Dominicans | 0.0 /100 | #332 | Tragic 8.3% |