Immigrants from Trinidad and Tobago vs Immigrants from Latvia Married-couple Households
COMPARE
Immigrants from Trinidad and Tobago
Immigrants from Latvia
Married-couple Households
Married-couple Households Comparison
Immigrants from Trinidad and Tobago
Immigrants from Latvia
41.2%
MARRIED-COUPLE HOUSEHOLDS
0.0/ 100
METRIC RATING
309th/ 347
METRIC RANK
46.0%
MARRIED-COUPLE HOUSEHOLDS
26.9/ 100
METRIC RATING
189th/ 347
METRIC RANK
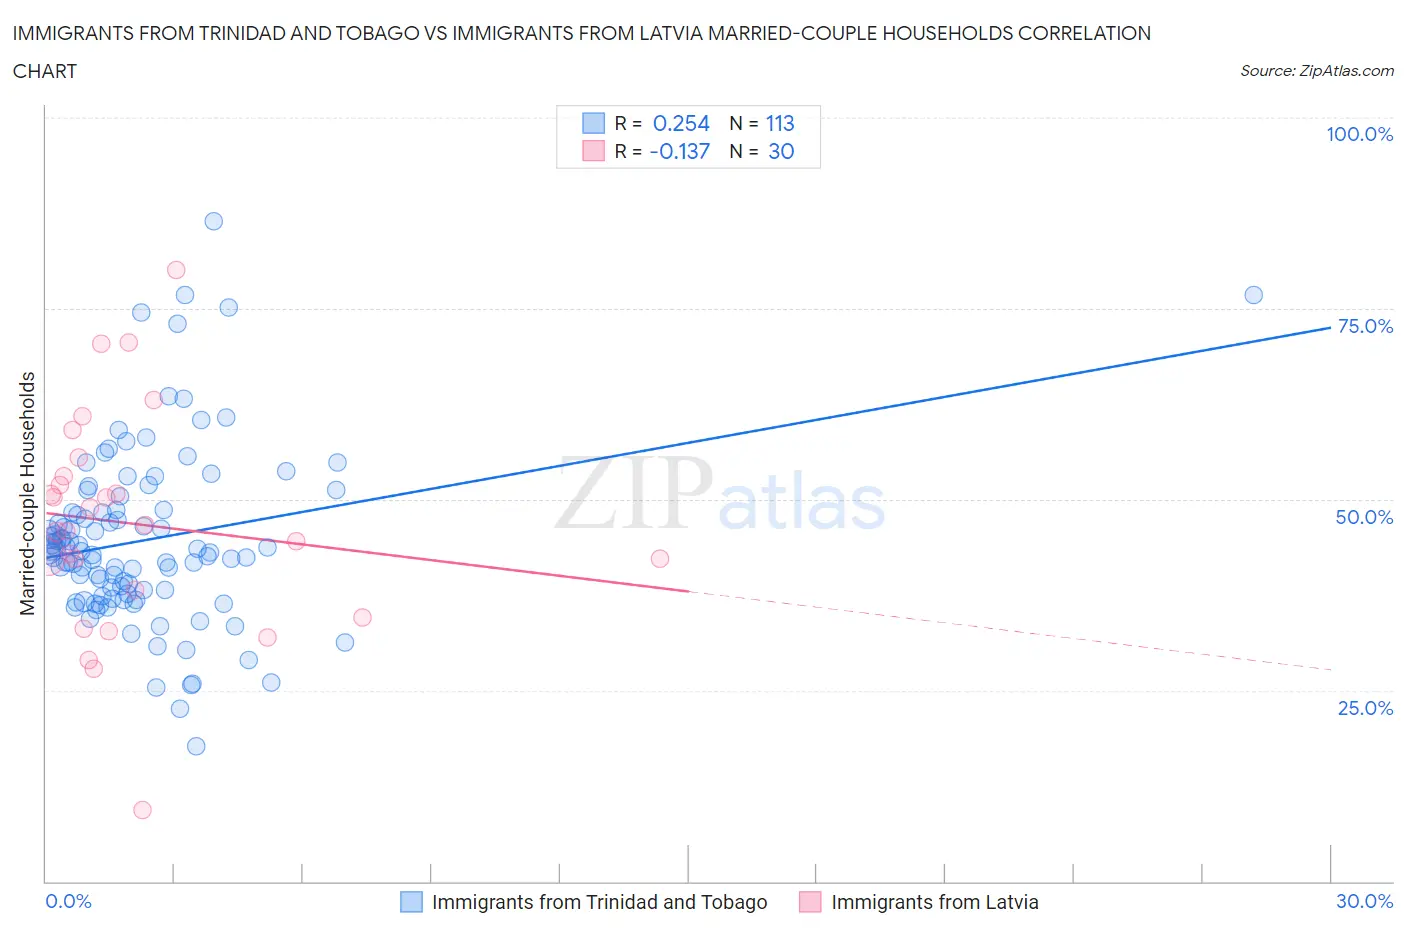
Immigrants from Trinidad and Tobago vs Immigrants from Latvia Married-couple Households Correlation Chart
The statistical analysis conducted on geographies consisting of 223,481,382 people shows a weak positive correlation between the proportion of Immigrants from Trinidad and Tobago and percentage of married-couple family households in the United States with a correlation coefficient (R) of 0.254 and weighted average of 41.2%. Similarly, the statistical analysis conducted on geographies consisting of 113,732,502 people shows a poor negative correlation between the proportion of Immigrants from Latvia and percentage of married-couple family households in the United States with a correlation coefficient (R) of -0.137 and weighted average of 46.0%, a difference of 11.7%.
Married-couple Households Correlation Summary
| Measurement | Immigrants from Trinidad and Tobago | Immigrants from Latvia |
| Minimum | 17.7% | 9.2% |
| Maximum | 86.4% | 80.0% |
| Range | 68.7% | 70.8% |
| Mean | 44.7% | 46.8% |
| Median | 43.2% | 46.2% |
| Interquartile 25% (IQ1) | 37.5% | 38.2% |
| Interquartile 75% (IQ3) | 48.6% | 53.0% |
| Interquartile Range (IQR) | 11.2% | 14.8% |
| Standard Deviation (Sample) | 11.5% | 14.4% |
| Standard Deviation (Population) | 11.5% | 14.2% |
Similar Demographics by Married-couple Households
Demographics Similar to Immigrants from Trinidad and Tobago by Married-couple Households
In terms of married-couple households, the demographic groups most similar to Immigrants from Trinidad and Tobago are Haitian (41.2%, a difference of 0.070%), Crow (41.4%, a difference of 0.35%), Guyanese (41.4%, a difference of 0.36%), Immigrants from Western Africa (41.4%, a difference of 0.36%), and Colville (41.0%, a difference of 0.57%).
| Demographics | Rating | Rank | Married-couple Households |
| Immigrants | Honduras | 0.0 /100 | #302 | Tragic 41.6% |
| Sub-Saharan Africans | 0.0 /100 | #303 | Tragic 41.6% |
| Immigrants | Guyana | 0.0 /100 | #304 | Tragic 41.6% |
| Sioux | 0.0 /100 | #305 | Tragic 41.5% |
| Guyanese | 0.0 /100 | #306 | Tragic 41.4% |
| Immigrants | Western Africa | 0.0 /100 | #307 | Tragic 41.4% |
| Crow | 0.0 /100 | #308 | Tragic 41.4% |
| Immigrants | Trinidad and Tobago | 0.0 /100 | #309 | Tragic 41.2% |
| Haitians | 0.0 /100 | #310 | Tragic 41.2% |
| Colville | 0.0 /100 | #311 | Tragic 41.0% |
| Africans | 0.0 /100 | #312 | Tragic 40.9% |
| Immigrants | Haiti | 0.0 /100 | #313 | Tragic 40.9% |
| Jamaicans | 0.0 /100 | #314 | Tragic 40.9% |
| Trinidadians and Tobagonians | 0.0 /100 | #315 | Tragic 40.9% |
| Immigrants | Caribbean | 0.0 /100 | #316 | Tragic 40.8% |
Demographics Similar to Immigrants from Latvia by Married-couple Households
In terms of married-couple households, the demographic groups most similar to Immigrants from Latvia are Immigrants from Kuwait (46.0%, a difference of 0.060%), South American Indian (46.0%, a difference of 0.070%), Choctaw (46.0%, a difference of 0.10%), Fijian (46.1%, a difference of 0.11%), and Immigrants from Northern Africa (46.0%, a difference of 0.11%).
| Demographics | Rating | Rank | Married-couple Households |
| Yugoslavians | 38.9 /100 | #182 | Fair 46.2% |
| Immigrants | Brazil | 38.3 /100 | #183 | Fair 46.2% |
| Immigrants | Switzerland | 36.9 /100 | #184 | Fair 46.2% |
| Brazilians | 35.9 /100 | #185 | Fair 46.2% |
| Albanians | 31.1 /100 | #186 | Fair 46.1% |
| Fijians | 29.2 /100 | #187 | Fair 46.1% |
| South American Indians | 28.4 /100 | #188 | Fair 46.0% |
| Immigrants | Latvia | 26.9 /100 | #189 | Fair 46.0% |
| Immigrants | Kuwait | 25.6 /100 | #190 | Fair 46.0% |
| Choctaw | 24.9 /100 | #191 | Fair 46.0% |
| Immigrants | Northern Africa | 24.6 /100 | #192 | Fair 46.0% |
| Taiwanese | 23.4 /100 | #193 | Fair 45.9% |
| Mexican American Indians | 23.3 /100 | #194 | Fair 45.9% |
| Chickasaw | 22.7 /100 | #195 | Fair 45.9% |
| Immigrants | South America | 22.2 /100 | #196 | Fair 45.9% |