Immigrants from Sierra Leone vs Immigrants from Hungary Family Poverty
COMPARE
Immigrants from Sierra Leone
Immigrants from Hungary
Family Poverty
Family Poverty Comparison
Immigrants from Sierra Leone
Immigrants from Hungary
9.4%
FAMILY POVERTY
19.6/ 100
METRIC RATING
202nd/ 347
METRIC RANK
8.4%
FAMILY POVERTY
89.9/ 100
METRIC RATING
127th/ 347
METRIC RANK
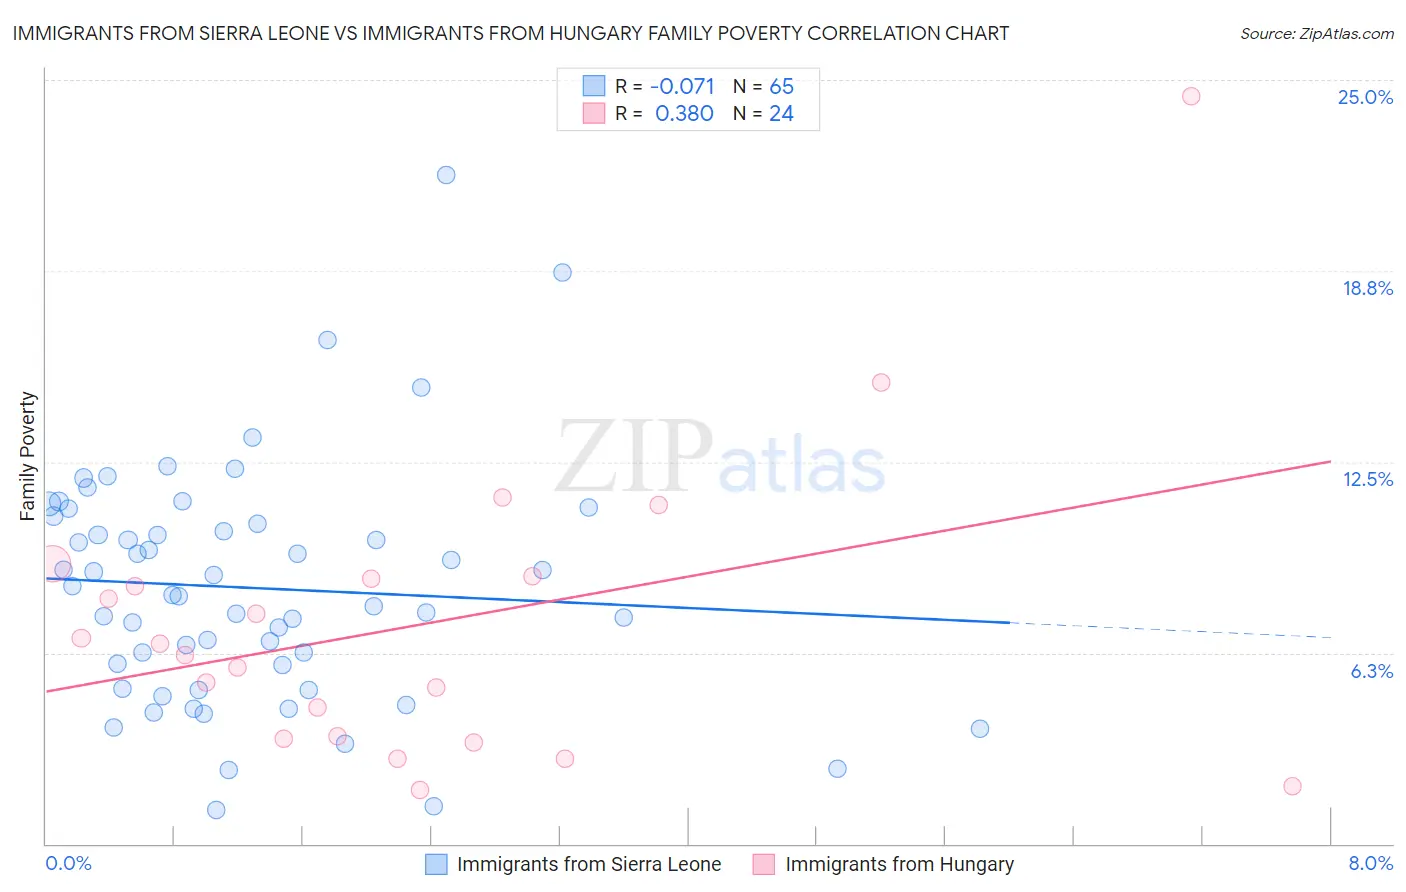
Immigrants from Sierra Leone vs Immigrants from Hungary Family Poverty Correlation Chart
The statistical analysis conducted on geographies consisting of 101,579,524 people shows a slight negative correlation between the proportion of Immigrants from Sierra Leone and poverty level among families in the United States with a correlation coefficient (R) of -0.071 and weighted average of 9.4%. Similarly, the statistical analysis conducted on geographies consisting of 195,433,579 people shows a mild positive correlation between the proportion of Immigrants from Hungary and poverty level among families in the United States with a correlation coefficient (R) of 0.380 and weighted average of 8.4%, a difference of 12.7%.
Family Poverty Correlation Summary
| Measurement | Immigrants from Sierra Leone | Immigrants from Hungary |
| Minimum | 1.1% | 1.8% |
| Maximum | 21.9% | 24.5% |
| Range | 20.8% | 22.7% |
| Mean | 8.4% | 7.2% |
| Median | 8.1% | 6.4% |
| Interquartile 25% (IQ1) | 5.5% | 3.5% |
| Interquartile 75% (IQ3) | 10.6% | 8.7% |
| Interquartile Range (IQR) | 5.1% | 5.2% |
| Standard Deviation (Sample) | 3.9% | 4.9% |
| Standard Deviation (Population) | 3.9% | 4.8% |
Similar Demographics by Family Poverty
Demographics Similar to Immigrants from Sierra Leone by Family Poverty
In terms of family poverty, the demographic groups most similar to Immigrants from Sierra Leone are German Russian (9.4%, a difference of 0.040%), Immigrants from Lebanon (9.4%, a difference of 0.14%), Immigrants from Portugal (9.4%, a difference of 0.17%), Aleut (9.5%, a difference of 0.33%), and Immigrants from South America (9.5%, a difference of 0.34%).
| Demographics | Rating | Rank | Family Poverty |
| Venezuelans | 27.4 /100 | #195 | Fair 9.3% |
| Immigrants | Venezuela | 26.1 /100 | #196 | Fair 9.3% |
| Immigrants | Colombia | 24.4 /100 | #197 | Fair 9.3% |
| Iraqis | 24.2 /100 | #198 | Fair 9.3% |
| Spaniards | 22.8 /100 | #199 | Fair 9.4% |
| Immigrants | Costa Rica | 21.7 /100 | #200 | Fair 9.4% |
| Immigrants | Portugal | 20.5 /100 | #201 | Fair 9.4% |
| Immigrants | Sierra Leone | 19.6 /100 | #202 | Poor 9.4% |
| German Russians | 19.4 /100 | #203 | Poor 9.4% |
| Immigrants | Lebanon | 18.9 /100 | #204 | Poor 9.4% |
| Aleuts | 18.0 /100 | #205 | Poor 9.5% |
| Immigrants | South America | 18.0 /100 | #206 | Poor 9.5% |
| Sierra Leoneans | 15.6 /100 | #207 | Poor 9.5% |
| Immigrants | Eastern Africa | 15.1 /100 | #208 | Poor 9.5% |
| Immigrants | Uruguay | 14.0 /100 | #209 | Poor 9.5% |
Demographics Similar to Immigrants from Hungary by Family Poverty
In terms of family poverty, the demographic groups most similar to Immigrants from Hungary are Icelander (8.3%, a difference of 0.13%), Argentinean (8.4%, a difference of 0.14%), Portuguese (8.4%, a difference of 0.30%), Pakistani (8.3%, a difference of 0.33%), and Soviet Union (8.3%, a difference of 0.37%).
| Demographics | Rating | Rank | Family Poverty |
| Immigrants | Egypt | 91.6 /100 | #120 | Exceptional 8.3% |
| Native Hawaiians | 91.3 /100 | #121 | Exceptional 8.3% |
| Paraguayans | 91.2 /100 | #122 | Exceptional 8.3% |
| Palestinians | 91.1 /100 | #123 | Exceptional 8.3% |
| Soviet Union | 90.8 /100 | #124 | Exceptional 8.3% |
| Pakistanis | 90.8 /100 | #125 | Exceptional 8.3% |
| Icelanders | 90.3 /100 | #126 | Exceptional 8.3% |
| Immigrants | Hungary | 89.9 /100 | #127 | Excellent 8.4% |
| Argentineans | 89.6 /100 | #128 | Excellent 8.4% |
| Portuguese | 89.2 /100 | #129 | Excellent 8.4% |
| Immigrants | Bosnia and Herzegovina | 88.6 /100 | #130 | Excellent 8.4% |
| Puget Sound Salish | 88.6 /100 | #131 | Excellent 8.4% |
| Immigrants | Argentina | 88.2 /100 | #132 | Excellent 8.4% |
| Sri Lankans | 86.6 /100 | #133 | Excellent 8.5% |
| Chileans | 86.6 /100 | #134 | Excellent 8.5% |