Puerto Rican vs Zimbabwean Married-Couple Family Poverty
COMPARE
Puerto Rican
Zimbabwean
Married-Couple Family Poverty
Married-Couple Family Poverty Comparison
Puerto Ricans
Zimbabweans
12.6%
MARRIED-COUPLE FAMILY POVERTY
0.0/ 100
METRIC RATING
345th/ 347
METRIC RANK
4.1%
MARRIED-COUPLE FAMILY POVERTY
99.9/ 100
METRIC RATING
21st/ 347
METRIC RANK
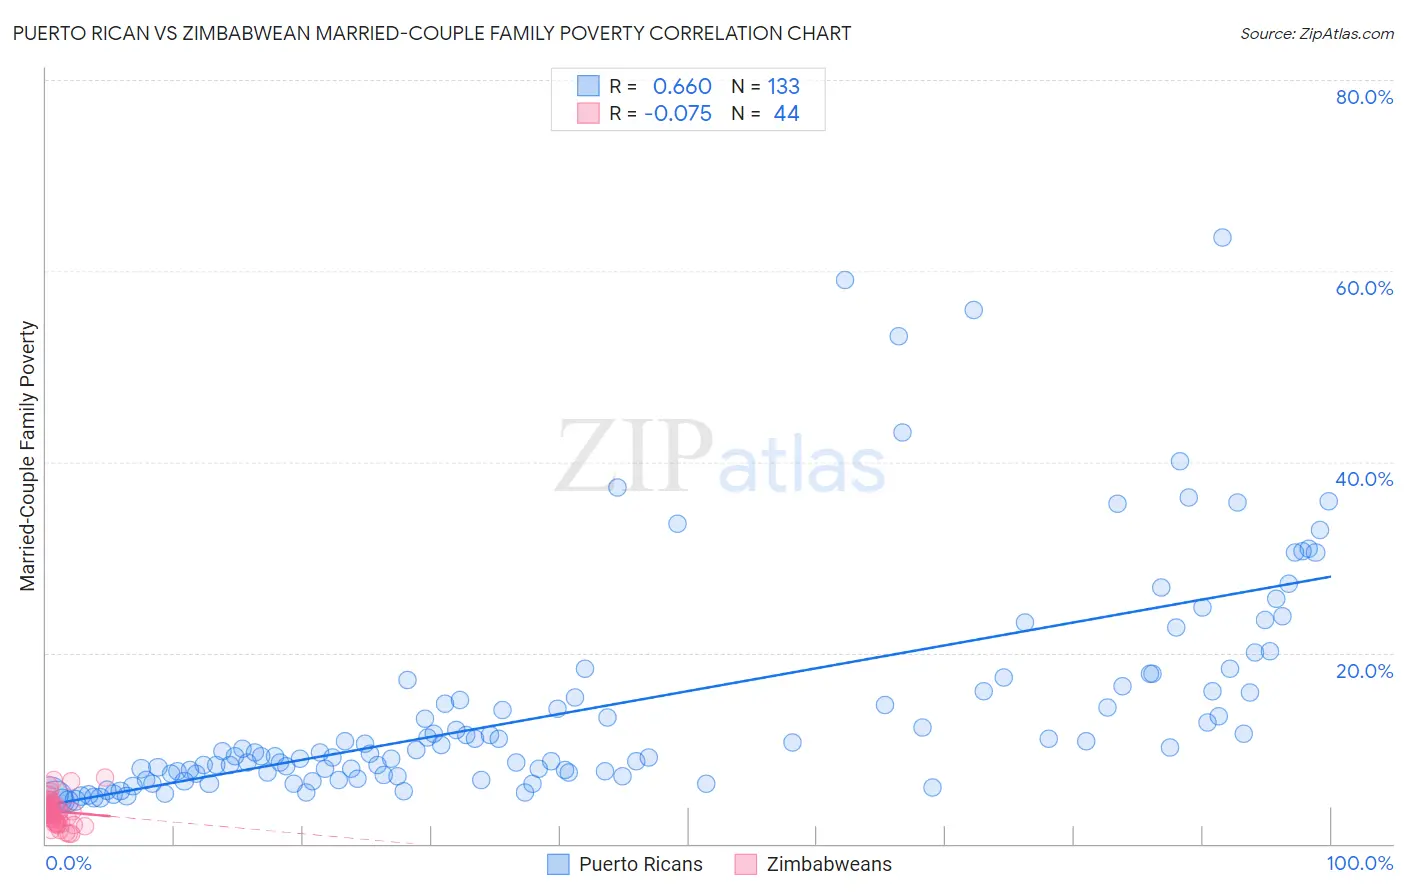
Puerto Rican vs Zimbabwean Married-Couple Family Poverty Correlation Chart
The statistical analysis conducted on geographies consisting of 519,143,813 people shows a significant positive correlation between the proportion of Puerto Ricans and poverty level among married-couple families in the United States with a correlation coefficient (R) of 0.660 and weighted average of 12.6%. Similarly, the statistical analysis conducted on geographies consisting of 69,119,087 people shows a slight negative correlation between the proportion of Zimbabweans and poverty level among married-couple families in the United States with a correlation coefficient (R) of -0.075 and weighted average of 4.1%, a difference of 209.7%.
Married-Couple Family Poverty Correlation Summary
| Measurement | Puerto Rican | Zimbabwean |
| Minimum | 4.4% | 1.0% |
| Maximum | 63.5% | 6.9% |
| Range | 59.1% | 5.9% |
| Mean | 14.4% | 3.4% |
| Median | 9.7% | 3.4% |
| Interquartile 25% (IQ1) | 7.2% | 2.2% |
| Interquartile 75% (IQ3) | 16.9% | 4.3% |
| Interquartile Range (IQR) | 9.6% | 2.1% |
| Standard Deviation (Sample) | 11.7% | 1.5% |
| Standard Deviation (Population) | 11.7% | 1.5% |
Similar Demographics by Married-Couple Family Poverty
Demographics Similar to Puerto Ricans by Married-Couple Family Poverty
In terms of married-couple family poverty, the demographic groups most similar to Puerto Ricans are Immigrants from Yemen (12.8%, a difference of 1.3%), Yup'ik (13.4%, a difference of 6.0%), Navajo (11.9%, a difference of 6.6%), Pima (11.4%, a difference of 10.8%), and Tohono O'odham (11.2%, a difference of 12.6%).
| Demographics | Rating | Rank | Married-Couple Family Poverty |
| Lumbee | 0.0 /100 | #333 | Tragic 8.3% |
| Immigrants | Dominican Republic | 0.0 /100 | #334 | Tragic 8.4% |
| Sioux | 0.0 /100 | #335 | Tragic 8.7% |
| Apache | 0.0 /100 | #336 | Tragic 9.0% |
| Yakama | 0.0 /100 | #337 | Tragic 9.0% |
| Cheyenne | 0.0 /100 | #338 | Tragic 9.4% |
| Crow | 0.0 /100 | #339 | Tragic 9.6% |
| Yuman | 0.0 /100 | #340 | Tragic 9.7% |
| Pueblo | 0.0 /100 | #341 | Tragic 11.1% |
| Tohono O'odham | 0.0 /100 | #342 | Tragic 11.2% |
| Pima | 0.0 /100 | #343 | Tragic 11.4% |
| Navajo | 0.0 /100 | #344 | Tragic 11.9% |
| Puerto Ricans | 0.0 /100 | #345 | Tragic 12.6% |
| Immigrants | Yemen | 0.0 /100 | #346 | Tragic 12.8% |
| Yup'ik | 0.0 /100 | #347 | Tragic 13.4% |
Demographics Similar to Zimbabweans by Married-Couple Family Poverty
In terms of married-couple family poverty, the demographic groups most similar to Zimbabweans are Maltese (4.1%, a difference of 0.030%), Immigrants from Ireland (4.1%, a difference of 0.27%), Immigrants from Singapore (4.1%, a difference of 0.37%), Bhutanese (4.1%, a difference of 0.39%), and Eastern European (4.1%, a difference of 0.62%).
| Demographics | Rating | Rank | Married-Couple Family Poverty |
| Slovaks | 100.0 /100 | #14 | Exceptional 4.0% |
| Poles | 100.0 /100 | #15 | Exceptional 4.0% |
| Germans | 100.0 /100 | #16 | Exceptional 4.0% |
| Filipinos | 100.0 /100 | #17 | Exceptional 4.0% |
| Italians | 100.0 /100 | #18 | Exceptional 4.0% |
| Immigrants | Ireland | 99.9 /100 | #19 | Exceptional 4.1% |
| Maltese | 99.9 /100 | #20 | Exceptional 4.1% |
| Zimbabweans | 99.9 /100 | #21 | Exceptional 4.1% |
| Immigrants | Singapore | 99.9 /100 | #22 | Exceptional 4.1% |
| Bhutanese | 99.9 /100 | #23 | Exceptional 4.1% |
| Eastern Europeans | 99.9 /100 | #24 | Exceptional 4.1% |
| Immigrants | Taiwan | 99.9 /100 | #25 | Exceptional 4.1% |
| Cypriots | 99.9 /100 | #26 | Exceptional 4.1% |
| Danes | 99.9 /100 | #27 | Exceptional 4.1% |
| Scandinavians | 99.9 /100 | #28 | Exceptional 4.1% |