Puget Sound Salish vs Zimbabwean Married-Couple Family Poverty
COMPARE
Puget Sound Salish
Zimbabwean
Married-Couple Family Poverty
Married-Couple Family Poverty Comparison
Puget Sound Salish
Zimbabweans
4.9%
MARRIED-COUPLE FAMILY POVERTY
90.4/ 100
METRIC RATING
132nd/ 347
METRIC RANK
4.1%
MARRIED-COUPLE FAMILY POVERTY
99.9/ 100
METRIC RATING
21st/ 347
METRIC RANK
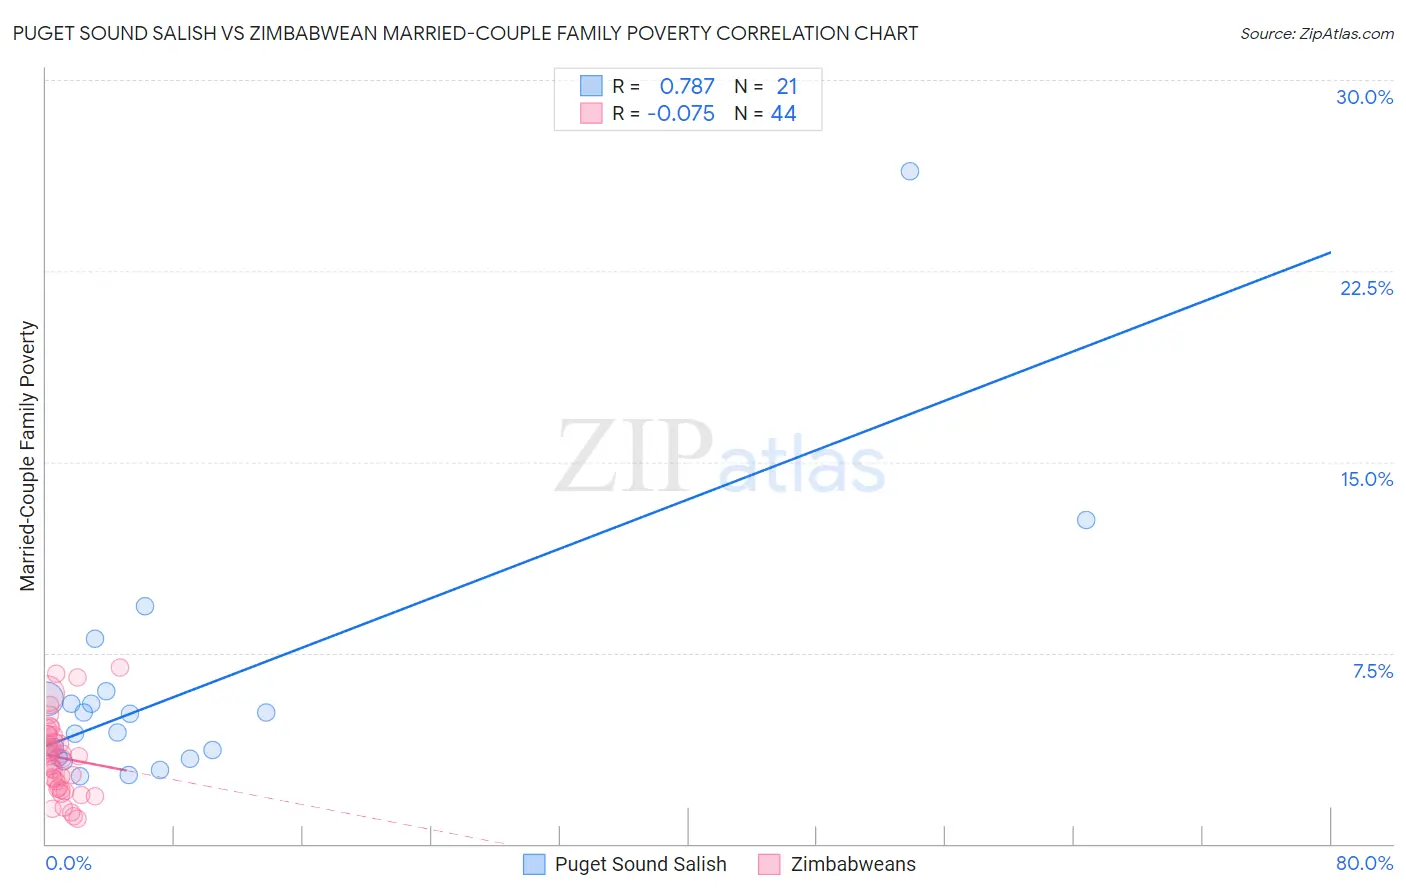
Puget Sound Salish vs Zimbabwean Married-Couple Family Poverty Correlation Chart
The statistical analysis conducted on geographies consisting of 46,044,429 people shows a strong positive correlation between the proportion of Puget Sound Salish and poverty level among married-couple families in the United States with a correlation coefficient (R) of 0.787 and weighted average of 4.9%. Similarly, the statistical analysis conducted on geographies consisting of 69,119,087 people shows a slight negative correlation between the proportion of Zimbabweans and poverty level among married-couple families in the United States with a correlation coefficient (R) of -0.075 and weighted average of 4.1%, a difference of 19.6%.
Married-Couple Family Poverty Correlation Summary
| Measurement | Puget Sound Salish | Zimbabwean |
| Minimum | 2.7% | 1.0% |
| Maximum | 26.4% | 6.9% |
| Range | 23.8% | 5.9% |
| Mean | 6.1% | 3.4% |
| Median | 5.1% | 3.4% |
| Interquartile 25% (IQ1) | 3.4% | 2.2% |
| Interquartile 75% (IQ3) | 5.8% | 4.3% |
| Interquartile Range (IQR) | 2.5% | 2.1% |
| Standard Deviation (Sample) | 5.2% | 1.5% |
| Standard Deviation (Population) | 5.1% | 1.5% |
Similar Demographics by Married-Couple Family Poverty
Demographics Similar to Puget Sound Salish by Married-Couple Family Poverty
In terms of married-couple family poverty, the demographic groups most similar to Puget Sound Salish are Immigrants from Eastern Europe (4.9%, a difference of 0.010%), Immigrants from Kenya (4.9%, a difference of 0.070%), Soviet Union (4.9%, a difference of 0.080%), Samoan (4.9%, a difference of 0.080%), and Immigrants from Pakistan (4.9%, a difference of 0.090%).
| Demographics | Rating | Rank | Married-Couple Family Poverty |
| Immigrants | Bosnia and Herzegovina | 92.5 /100 | #125 | Exceptional 4.8% |
| Immigrants | Asia | 92.3 /100 | #126 | Exceptional 4.8% |
| Egyptians | 92.0 /100 | #127 | Exceptional 4.8% |
| Palestinians | 91.2 /100 | #128 | Exceptional 4.9% |
| Immigrants | Pakistan | 90.7 /100 | #129 | Exceptional 4.9% |
| Soviet Union | 90.7 /100 | #130 | Exceptional 4.9% |
| Immigrants | Eastern Europe | 90.5 /100 | #131 | Exceptional 4.9% |
| Puget Sound Salish | 90.4 /100 | #132 | Exceptional 4.9% |
| Immigrants | Kenya | 90.2 /100 | #133 | Exceptional 4.9% |
| Samoans | 90.2 /100 | #134 | Exceptional 4.9% |
| Assyrians/Chaldeans/Syriacs | 89.4 /100 | #135 | Excellent 4.9% |
| Immigrants | Hungary | 88.7 /100 | #136 | Excellent 4.9% |
| Guamanians/Chamorros | 86.5 /100 | #137 | Excellent 4.9% |
| Chileans | 86.0 /100 | #138 | Excellent 4.9% |
| German Russians | 85.1 /100 | #139 | Excellent 5.0% |
Demographics Similar to Zimbabweans by Married-Couple Family Poverty
In terms of married-couple family poverty, the demographic groups most similar to Zimbabweans are Maltese (4.1%, a difference of 0.030%), Immigrants from Ireland (4.1%, a difference of 0.27%), Immigrants from Singapore (4.1%, a difference of 0.37%), Bhutanese (4.1%, a difference of 0.39%), and Eastern European (4.1%, a difference of 0.62%).
| Demographics | Rating | Rank | Married-Couple Family Poverty |
| Slovaks | 100.0 /100 | #14 | Exceptional 4.0% |
| Poles | 100.0 /100 | #15 | Exceptional 4.0% |
| Germans | 100.0 /100 | #16 | Exceptional 4.0% |
| Filipinos | 100.0 /100 | #17 | Exceptional 4.0% |
| Italians | 100.0 /100 | #18 | Exceptional 4.0% |
| Immigrants | Ireland | 99.9 /100 | #19 | Exceptional 4.1% |
| Maltese | 99.9 /100 | #20 | Exceptional 4.1% |
| Zimbabweans | 99.9 /100 | #21 | Exceptional 4.1% |
| Immigrants | Singapore | 99.9 /100 | #22 | Exceptional 4.1% |
| Bhutanese | 99.9 /100 | #23 | Exceptional 4.1% |
| Eastern Europeans | 99.9 /100 | #24 | Exceptional 4.1% |
| Immigrants | Taiwan | 99.9 /100 | #25 | Exceptional 4.1% |
| Cypriots | 99.9 /100 | #26 | Exceptional 4.1% |
| Danes | 99.9 /100 | #27 | Exceptional 4.1% |
| Scandinavians | 99.9 /100 | #28 | Exceptional 4.1% |