Immigrants from Netherlands vs Pima Married-Couple Family Poverty
COMPARE
Immigrants from Netherlands
Pima
Married-Couple Family Poverty
Married-Couple Family Poverty Comparison
Immigrants from Netherlands
Pima
4.3%
MARRIED-COUPLE FAMILY POVERTY
99.7/ 100
METRIC RATING
57th/ 347
METRIC RANK
11.4%
MARRIED-COUPLE FAMILY POVERTY
0.0/ 100
METRIC RATING
343rd/ 347
METRIC RANK
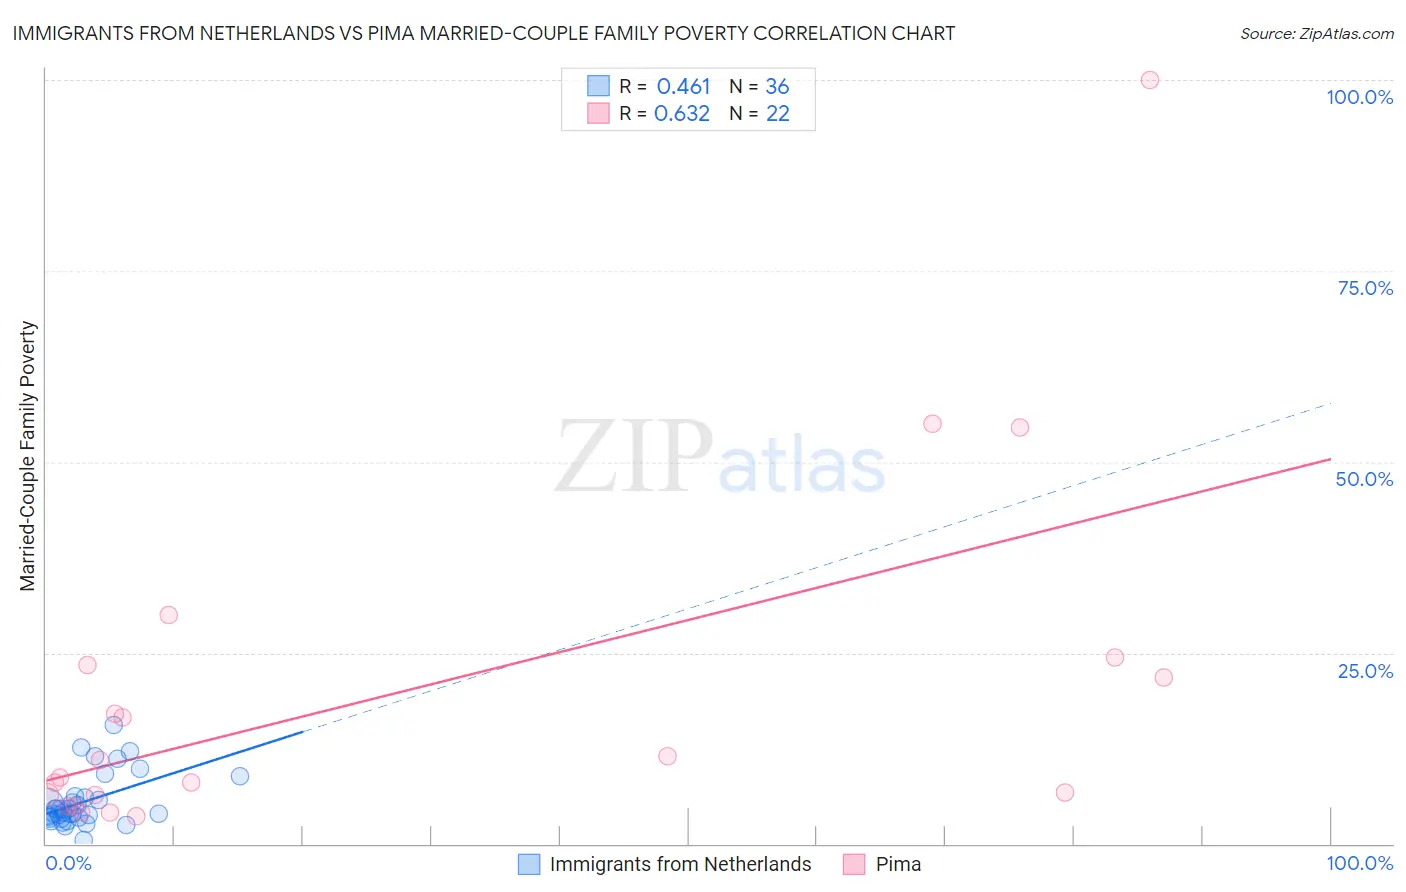
Immigrants from Netherlands vs Pima Married-Couple Family Poverty Correlation Chart
The statistical analysis conducted on geographies consisting of 236,404,410 people shows a moderate positive correlation between the proportion of Immigrants from Netherlands and poverty level among married-couple families in the United States with a correlation coefficient (R) of 0.461 and weighted average of 4.3%. Similarly, the statistical analysis conducted on geographies consisting of 61,466,640 people shows a significant positive correlation between the proportion of Pima and poverty level among married-couple families in the United States with a correlation coefficient (R) of 0.632 and weighted average of 11.4%, a difference of 162.4%.
Married-Couple Family Poverty Correlation Summary
| Measurement | Immigrants from Netherlands | Pima |
| Minimum | 0.44% | 3.6% |
| Maximum | 15.6% | 100.0% |
| Range | 15.2% | 96.4% |
| Mean | 5.5% | 19.6% |
| Median | 4.3% | 9.9% |
| Interquartile 25% (IQ1) | 3.4% | 6.4% |
| Interquartile 75% (IQ3) | 6.2% | 23.4% |
| Interquartile Range (IQR) | 2.8% | 17.0% |
| Standard Deviation (Sample) | 3.5% | 23.2% |
| Standard Deviation (Population) | 3.4% | 22.7% |
Similar Demographics by Married-Couple Family Poverty
Demographics Similar to Immigrants from Netherlands by Married-Couple Family Poverty
In terms of married-couple family poverty, the demographic groups most similar to Immigrants from Netherlands are Immigrants from Zimbabwe (4.3%, a difference of 0.0%), Czechoslovakian (4.4%, a difference of 0.090%), French (4.3%, a difference of 0.16%), Austrian (4.3%, a difference of 0.18%), and Welsh (4.3%, a difference of 0.45%).
| Demographics | Rating | Rank | Married-Couple Family Poverty |
| Burmese | 99.7 /100 | #50 | Exceptional 4.3% |
| Immigrants | Lithuania | 99.7 /100 | #51 | Exceptional 4.3% |
| Russians | 99.7 /100 | #52 | Exceptional 4.3% |
| Welsh | 99.7 /100 | #53 | Exceptional 4.3% |
| Austrians | 99.7 /100 | #54 | Exceptional 4.3% |
| French | 99.7 /100 | #55 | Exceptional 4.3% |
| Immigrants | Zimbabwe | 99.7 /100 | #56 | Exceptional 4.3% |
| Immigrants | Netherlands | 99.7 /100 | #57 | Exceptional 4.3% |
| Czechoslovakians | 99.7 /100 | #58 | Exceptional 4.4% |
| Immigrants | Sweden | 99.6 /100 | #59 | Exceptional 4.4% |
| Tlingit-Haida | 99.6 /100 | #60 | Exceptional 4.4% |
| Okinawans | 99.6 /100 | #61 | Exceptional 4.4% |
| Immigrants | Australia | 99.6 /100 | #62 | Exceptional 4.4% |
| Immigrants | Sri Lanka | 99.6 /100 | #63 | Exceptional 4.4% |
| Immigrants | Bulgaria | 99.5 /100 | #64 | Exceptional 4.4% |
Demographics Similar to Pima by Married-Couple Family Poverty
In terms of married-couple family poverty, the demographic groups most similar to Pima are Tohono O'odham (11.2%, a difference of 1.7%), Pueblo (11.1%, a difference of 2.6%), Navajo (11.9%, a difference of 3.9%), Puerto Rican (12.6%, a difference of 10.8%), and Immigrants from Yemen (12.8%, a difference of 12.2%).
| Demographics | Rating | Rank | Married-Couple Family Poverty |
| Lumbee | 0.0 /100 | #333 | Tragic 8.3% |
| Immigrants | Dominican Republic | 0.0 /100 | #334 | Tragic 8.4% |
| Sioux | 0.0 /100 | #335 | Tragic 8.7% |
| Apache | 0.0 /100 | #336 | Tragic 9.0% |
| Yakama | 0.0 /100 | #337 | Tragic 9.0% |
| Cheyenne | 0.0 /100 | #338 | Tragic 9.4% |
| Crow | 0.0 /100 | #339 | Tragic 9.6% |
| Yuman | 0.0 /100 | #340 | Tragic 9.7% |
| Pueblo | 0.0 /100 | #341 | Tragic 11.1% |
| Tohono O'odham | 0.0 /100 | #342 | Tragic 11.2% |
| Pima | 0.0 /100 | #343 | Tragic 11.4% |
| Navajo | 0.0 /100 | #344 | Tragic 11.9% |
| Puerto Ricans | 0.0 /100 | #345 | Tragic 12.6% |
| Immigrants | Yemen | 0.0 /100 | #346 | Tragic 12.8% |
| Yup'ik | 0.0 /100 | #347 | Tragic 13.4% |