Immigrants from Netherlands vs Immigrants Married-Couple Family Poverty
COMPARE
Immigrants from Netherlands
Immigrants
Married-Couple Family Poverty
Married-Couple Family Poverty Comparison
Immigrants from Netherlands
Immigrants
4.3%
MARRIED-COUPLE FAMILY POVERTY
99.7/ 100
METRIC RATING
57th/ 347
METRIC RANK
6.0%
MARRIED-COUPLE FAMILY POVERTY
0.5/ 100
METRIC RATING
258th/ 347
METRIC RANK
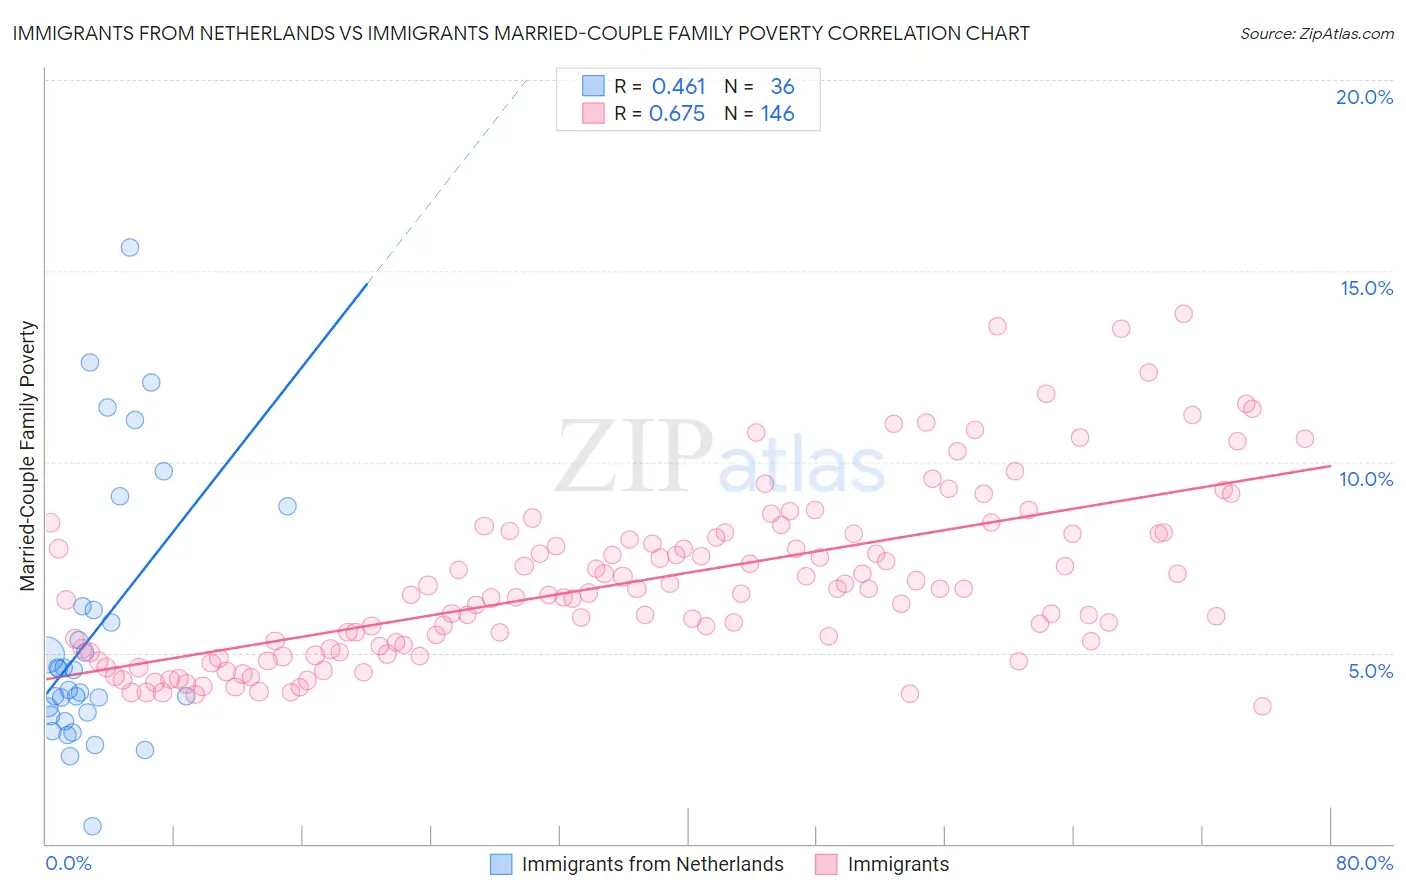
Immigrants from Netherlands vs Immigrants Married-Couple Family Poverty Correlation Chart
The statistical analysis conducted on geographies consisting of 236,404,410 people shows a moderate positive correlation between the proportion of Immigrants from Netherlands and poverty level among married-couple families in the United States with a correlation coefficient (R) of 0.461 and weighted average of 4.3%. Similarly, the statistical analysis conducted on geographies consisting of 562,504,380 people shows a significant positive correlation between the proportion of Immigrants and poverty level among married-couple families in the United States with a correlation coefficient (R) of 0.675 and weighted average of 6.0%, a difference of 38.8%.
Married-Couple Family Poverty Correlation Summary
| Measurement | Immigrants from Netherlands | Immigrants |
| Minimum | 0.44% | 3.6% |
| Maximum | 15.6% | 13.9% |
| Range | 15.2% | 10.3% |
| Mean | 5.5% | 6.9% |
| Median | 4.3% | 6.6% |
| Interquartile 25% (IQ1) | 3.4% | 5.1% |
| Interquartile 75% (IQ3) | 6.2% | 8.1% |
| Interquartile Range (IQR) | 2.8% | 3.0% |
| Standard Deviation (Sample) | 3.5% | 2.2% |
| Standard Deviation (Population) | 3.4% | 2.2% |
Similar Demographics by Married-Couple Family Poverty
Demographics Similar to Immigrants from Netherlands by Married-Couple Family Poverty
In terms of married-couple family poverty, the demographic groups most similar to Immigrants from Netherlands are Immigrants from Zimbabwe (4.3%, a difference of 0.0%), Czechoslovakian (4.4%, a difference of 0.090%), French (4.3%, a difference of 0.16%), Austrian (4.3%, a difference of 0.18%), and Welsh (4.3%, a difference of 0.45%).
| Demographics | Rating | Rank | Married-Couple Family Poverty |
| Burmese | 99.7 /100 | #50 | Exceptional 4.3% |
| Immigrants | Lithuania | 99.7 /100 | #51 | Exceptional 4.3% |
| Russians | 99.7 /100 | #52 | Exceptional 4.3% |
| Welsh | 99.7 /100 | #53 | Exceptional 4.3% |
| Austrians | 99.7 /100 | #54 | Exceptional 4.3% |
| French | 99.7 /100 | #55 | Exceptional 4.3% |
| Immigrants | Zimbabwe | 99.7 /100 | #56 | Exceptional 4.3% |
| Immigrants | Netherlands | 99.7 /100 | #57 | Exceptional 4.3% |
| Czechoslovakians | 99.7 /100 | #58 | Exceptional 4.4% |
| Immigrants | Sweden | 99.6 /100 | #59 | Exceptional 4.4% |
| Tlingit-Haida | 99.6 /100 | #60 | Exceptional 4.4% |
| Okinawans | 99.6 /100 | #61 | Exceptional 4.4% |
| Immigrants | Australia | 99.6 /100 | #62 | Exceptional 4.4% |
| Immigrants | Sri Lanka | 99.6 /100 | #63 | Exceptional 4.4% |
| Immigrants | Bulgaria | 99.5 /100 | #64 | Exceptional 4.4% |
Demographics Similar to Immigrants by Married-Couple Family Poverty
In terms of married-couple family poverty, the demographic groups most similar to Immigrants are Immigrants from Burma/Myanmar (6.0%, a difference of 0.13%), Bangladeshi (6.0%, a difference of 0.37%), Alaskan Athabascan (6.1%, a difference of 0.58%), Jamaican (6.1%, a difference of 0.79%), and Comanche (6.0%, a difference of 0.87%).
| Demographics | Rating | Rank | Married-Couple Family Poverty |
| Immigrants | Ghana | 1.0 /100 | #251 | Tragic 5.9% |
| Immigrants | Western Asia | 0.7 /100 | #252 | Tragic 6.0% |
| Africans | 0.7 /100 | #253 | Tragic 6.0% |
| Immigrants | Somalia | 0.7 /100 | #254 | Tragic 6.0% |
| Comanche | 0.7 /100 | #255 | Tragic 6.0% |
| Bangladeshis | 0.5 /100 | #256 | Tragic 6.0% |
| Immigrants | Burma/Myanmar | 0.5 /100 | #257 | Tragic 6.0% |
| Immigrants | Immigrants | 0.5 /100 | #258 | Tragic 6.0% |
| Alaskan Athabascans | 0.4 /100 | #259 | Tragic 6.1% |
| Jamaicans | 0.3 /100 | #260 | Tragic 6.1% |
| Senegalese | 0.3 /100 | #261 | Tragic 6.1% |
| Shoshone | 0.3 /100 | #262 | Tragic 6.1% |
| Immigrants | Senegal | 0.3 /100 | #263 | Tragic 6.1% |
| Immigrants | Congo | 0.2 /100 | #264 | Tragic 6.1% |
| Blackfeet | 0.2 /100 | #265 | Tragic 6.2% |