Immigrants from Netherlands vs Immigrants from Oceania Married-Couple Family Poverty
COMPARE
Immigrants from Netherlands
Immigrants from Oceania
Married-Couple Family Poverty
Married-Couple Family Poverty Comparison
Immigrants from Netherlands
Immigrants from Oceania
4.3%
MARRIED-COUPLE FAMILY POVERTY
99.7/ 100
METRIC RATING
57th/ 347
METRIC RANK
5.0%
MARRIED-COUPLE FAMILY POVERTY
78.6/ 100
METRIC RATING
149th/ 347
METRIC RANK
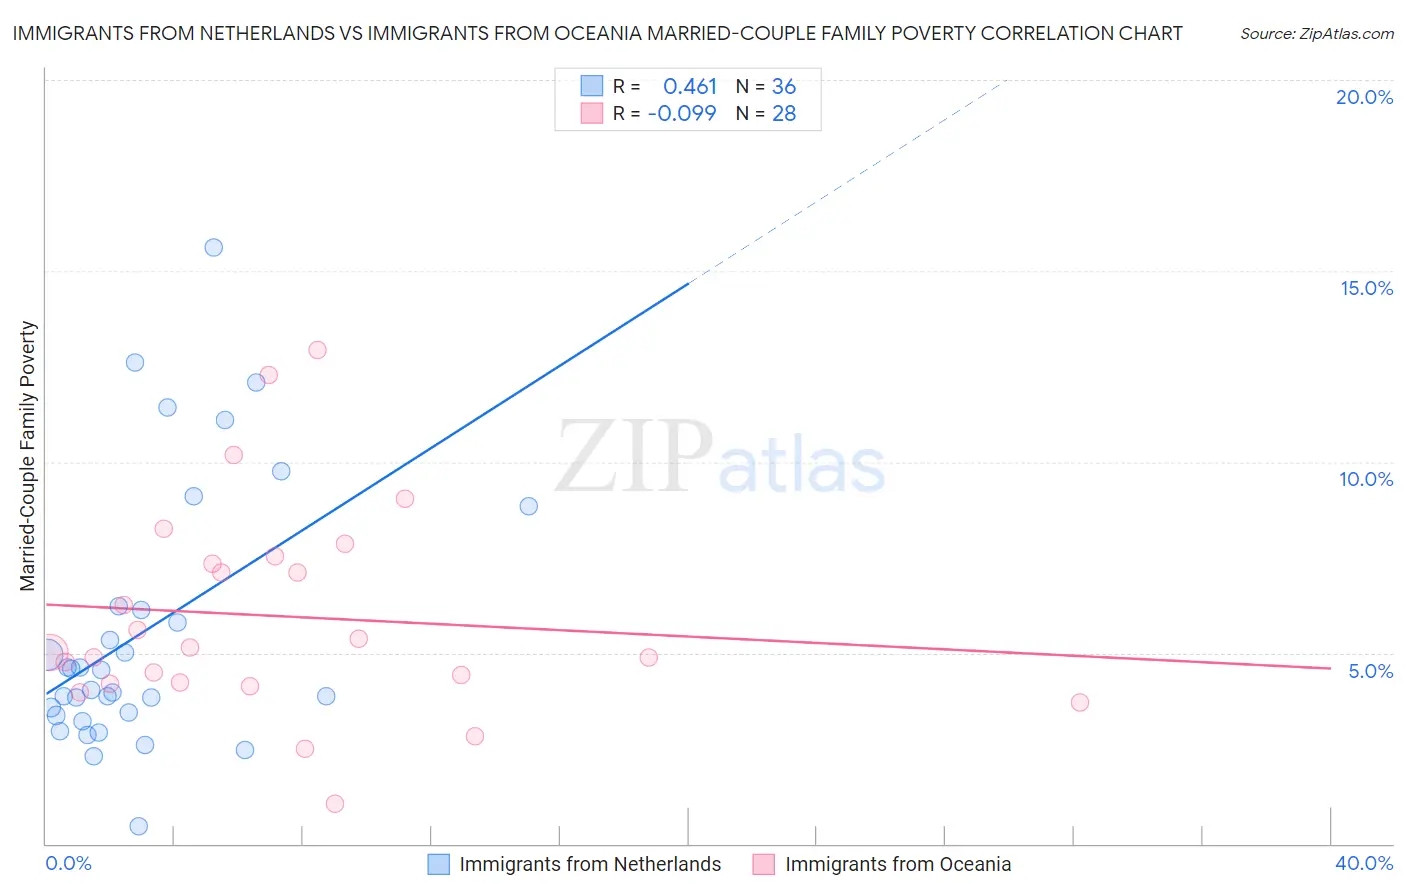
Immigrants from Netherlands vs Immigrants from Oceania Married-Couple Family Poverty Correlation Chart
The statistical analysis conducted on geographies consisting of 236,404,410 people shows a moderate positive correlation between the proportion of Immigrants from Netherlands and poverty level among married-couple families in the United States with a correlation coefficient (R) of 0.461 and weighted average of 4.3%. Similarly, the statistical analysis conducted on geographies consisting of 303,370,151 people shows a slight negative correlation between the proportion of Immigrants from Oceania and poverty level among married-couple families in the United States with a correlation coefficient (R) of -0.099 and weighted average of 5.0%, a difference of 15.5%.
Married-Couple Family Poverty Correlation Summary
| Measurement | Immigrants from Netherlands | Immigrants from Oceania |
| Minimum | 0.44% | 1.0% |
| Maximum | 15.6% | 12.9% |
| Range | 15.2% | 11.9% |
| Mean | 5.5% | 6.0% |
| Median | 4.3% | 5.1% |
| Interquartile 25% (IQ1) | 3.4% | 4.2% |
| Interquartile 75% (IQ3) | 6.2% | 7.4% |
| Interquartile Range (IQR) | 2.8% | 3.2% |
| Standard Deviation (Sample) | 3.5% | 2.8% |
| Standard Deviation (Population) | 3.4% | 2.7% |
Similar Demographics by Married-Couple Family Poverty
Demographics Similar to Immigrants from Netherlands by Married-Couple Family Poverty
In terms of married-couple family poverty, the demographic groups most similar to Immigrants from Netherlands are Immigrants from Zimbabwe (4.3%, a difference of 0.0%), Czechoslovakian (4.4%, a difference of 0.090%), French (4.3%, a difference of 0.16%), Austrian (4.3%, a difference of 0.18%), and Welsh (4.3%, a difference of 0.45%).
| Demographics | Rating | Rank | Married-Couple Family Poverty |
| Burmese | 99.7 /100 | #50 | Exceptional 4.3% |
| Immigrants | Lithuania | 99.7 /100 | #51 | Exceptional 4.3% |
| Russians | 99.7 /100 | #52 | Exceptional 4.3% |
| Welsh | 99.7 /100 | #53 | Exceptional 4.3% |
| Austrians | 99.7 /100 | #54 | Exceptional 4.3% |
| French | 99.7 /100 | #55 | Exceptional 4.3% |
| Immigrants | Zimbabwe | 99.7 /100 | #56 | Exceptional 4.3% |
| Immigrants | Netherlands | 99.7 /100 | #57 | Exceptional 4.3% |
| Czechoslovakians | 99.7 /100 | #58 | Exceptional 4.4% |
| Immigrants | Sweden | 99.6 /100 | #59 | Exceptional 4.4% |
| Tlingit-Haida | 99.6 /100 | #60 | Exceptional 4.4% |
| Okinawans | 99.6 /100 | #61 | Exceptional 4.4% |
| Immigrants | Australia | 99.6 /100 | #62 | Exceptional 4.4% |
| Immigrants | Sri Lanka | 99.6 /100 | #63 | Exceptional 4.4% |
| Immigrants | Bulgaria | 99.5 /100 | #64 | Exceptional 4.4% |
Demographics Similar to Immigrants from Oceania by Married-Couple Family Poverty
In terms of married-couple family poverty, the demographic groups most similar to Immigrants from Oceania are Syrian (5.0%, a difference of 0.030%), Immigrants from Russia (5.0%, a difference of 0.030%), Brazilian (5.0%, a difference of 0.050%), Mongolian (5.0%, a difference of 0.22%), and Immigrants from Cameroon (5.0%, a difference of 0.23%).
| Demographics | Rating | Rank | Married-Couple Family Poverty |
| Immigrants | China | 84.6 /100 | #142 | Excellent 5.0% |
| Immigrants | Egypt | 83.4 /100 | #143 | Excellent 5.0% |
| Hmong | 83.2 /100 | #144 | Excellent 5.0% |
| Immigrants | Spain | 79.9 /100 | #145 | Good 5.0% |
| Mongolians | 79.8 /100 | #146 | Good 5.0% |
| Syrians | 78.7 /100 | #147 | Good 5.0% |
| Immigrants | Russia | 78.7 /100 | #148 | Good 5.0% |
| Immigrants | Oceania | 78.6 /100 | #149 | Good 5.0% |
| Brazilians | 78.3 /100 | #150 | Good 5.0% |
| Immigrants | Cameroon | 77.3 /100 | #151 | Good 5.0% |
| Albanians | 77.2 /100 | #152 | Good 5.0% |
| Immigrants | Kuwait | 76.3 /100 | #153 | Good 5.0% |
| Delaware | 73.7 /100 | #154 | Good 5.1% |
| Immigrants | Ethiopia | 72.4 /100 | #155 | Good 5.1% |
| Sri Lankans | 72.2 /100 | #156 | Good 5.1% |