Immigrants from Kazakhstan vs Immigrants from Oceania Female Poverty
COMPARE
Immigrants from Kazakhstan
Immigrants from Oceania
Female Poverty
Female Poverty Comparison
Immigrants from Kazakhstan
Immigrants from Oceania
13.0%
FEMALE POVERTY
78.6/ 100
METRIC RATING
147th/ 347
METRIC RANK
13.3%
FEMALE POVERTY
59.7/ 100
METRIC RATING
166th/ 347
METRIC RANK
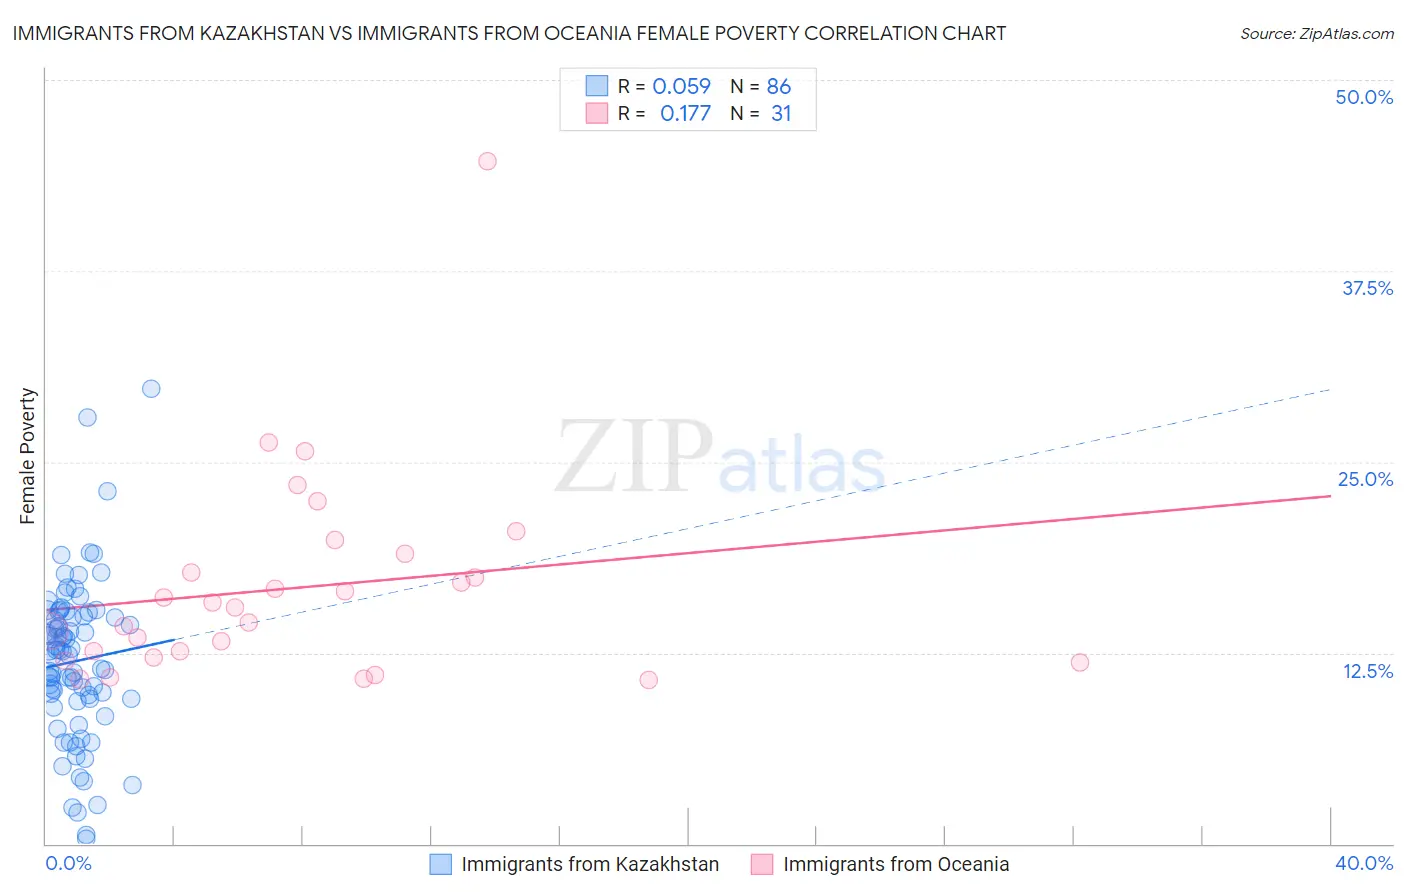
Immigrants from Kazakhstan vs Immigrants from Oceania Female Poverty Correlation Chart
The statistical analysis conducted on geographies consisting of 124,418,226 people shows a slight positive correlation between the proportion of Immigrants from Kazakhstan and poverty level among females in the United States with a correlation coefficient (R) of 0.059 and weighted average of 13.0%. Similarly, the statistical analysis conducted on geographies consisting of 305,339,012 people shows a poor positive correlation between the proportion of Immigrants from Oceania and poverty level among females in the United States with a correlation coefficient (R) of 0.177 and weighted average of 13.3%, a difference of 2.2%.
Female Poverty Correlation Summary
| Measurement | Immigrants from Kazakhstan | Immigrants from Oceania |
| Minimum | 0.34% | 10.7% |
| Maximum | 29.8% | 44.6% |
| Range | 29.4% | 33.9% |
| Mean | 11.9% | 16.8% |
| Median | 12.5% | 15.5% |
| Interquartile 25% (IQ1) | 9.5% | 12.2% |
| Interquartile 75% (IQ3) | 14.9% | 19.0% |
| Interquartile Range (IQR) | 5.4% | 6.8% |
| Standard Deviation (Sample) | 5.2% | 6.8% |
| Standard Deviation (Population) | 5.2% | 6.7% |
Demographics Similar to Immigrants from Kazakhstan and Immigrants from Oceania by Female Poverty
In terms of female poverty, the demographic groups most similar to Immigrants from Kazakhstan are Immigrants from Peru (13.0%, a difference of 0.080%), Yugoslavian (13.1%, a difference of 0.25%), Taiwanese (13.1%, a difference of 0.41%), Tsimshian (13.1%, a difference of 0.44%), and Immigrants from Germany (13.1%, a difference of 0.51%). Similarly, the demographic groups most similar to Immigrants from Oceania are Scotch-Irish (13.3%, a difference of 0.24%), Ethiopian (13.3%, a difference of 0.26%), Guamanian/Chamorro (13.3%, a difference of 0.27%), Immigrants from Albania (13.3%, a difference of 0.27%), and Immigrants from Ethiopia (13.3%, a difference of 0.28%).
| Demographics | Rating | Rank | Female Poverty |
| Immigrants | Peru | 79.1 /100 | #146 | Good 13.0% |
| Immigrants | Kazakhstan | 78.6 /100 | #147 | Good 13.0% |
| Yugoslavians | 76.9 /100 | #148 | Good 13.1% |
| Taiwanese | 75.7 /100 | #149 | Good 13.1% |
| Tsimshian | 75.5 /100 | #150 | Good 13.1% |
| Immigrants | Germany | 74.9 /100 | #151 | Good 13.1% |
| Samoans | 73.6 /100 | #152 | Good 13.1% |
| Immigrants | Fiji | 71.0 /100 | #153 | Good 13.2% |
| Armenians | 70.4 /100 | #154 | Good 13.2% |
| Hungarians | 70.1 /100 | #155 | Good 13.2% |
| Immigrants | Bosnia and Herzegovina | 69.7 /100 | #156 | Good 13.2% |
| Immigrants | Northern Africa | 68.8 /100 | #157 | Good 13.2% |
| Pennsylvania Germans | 67.3 /100 | #158 | Good 13.2% |
| Costa Ricans | 63.6 /100 | #159 | Good 13.3% |
| Immigrants | Nepal | 62.7 /100 | #160 | Good 13.3% |
| Immigrants | Ethiopia | 62.5 /100 | #161 | Good 13.3% |
| Guamanians/Chamorros | 62.4 /100 | #162 | Good 13.3% |
| Immigrants | Albania | 62.4 /100 | #163 | Good 13.3% |
| Ethiopians | 62.3 /100 | #164 | Good 13.3% |
| Scotch-Irish | 62.1 /100 | #165 | Good 13.3% |
| Immigrants | Oceania | 59.7 /100 | #166 | Average 13.3% |