Immigrants from Kazakhstan vs Bermudan Female Poverty
COMPARE
Immigrants from Kazakhstan
Bermudan
Female Poverty
Female Poverty Comparison
Immigrants from Kazakhstan
Bermudans
13.0%
FEMALE POVERTY
78.6/ 100
METRIC RATING
147th/ 347
METRIC RANK
14.4%
FEMALE POVERTY
5.5/ 100
METRIC RATING
212th/ 347
METRIC RANK
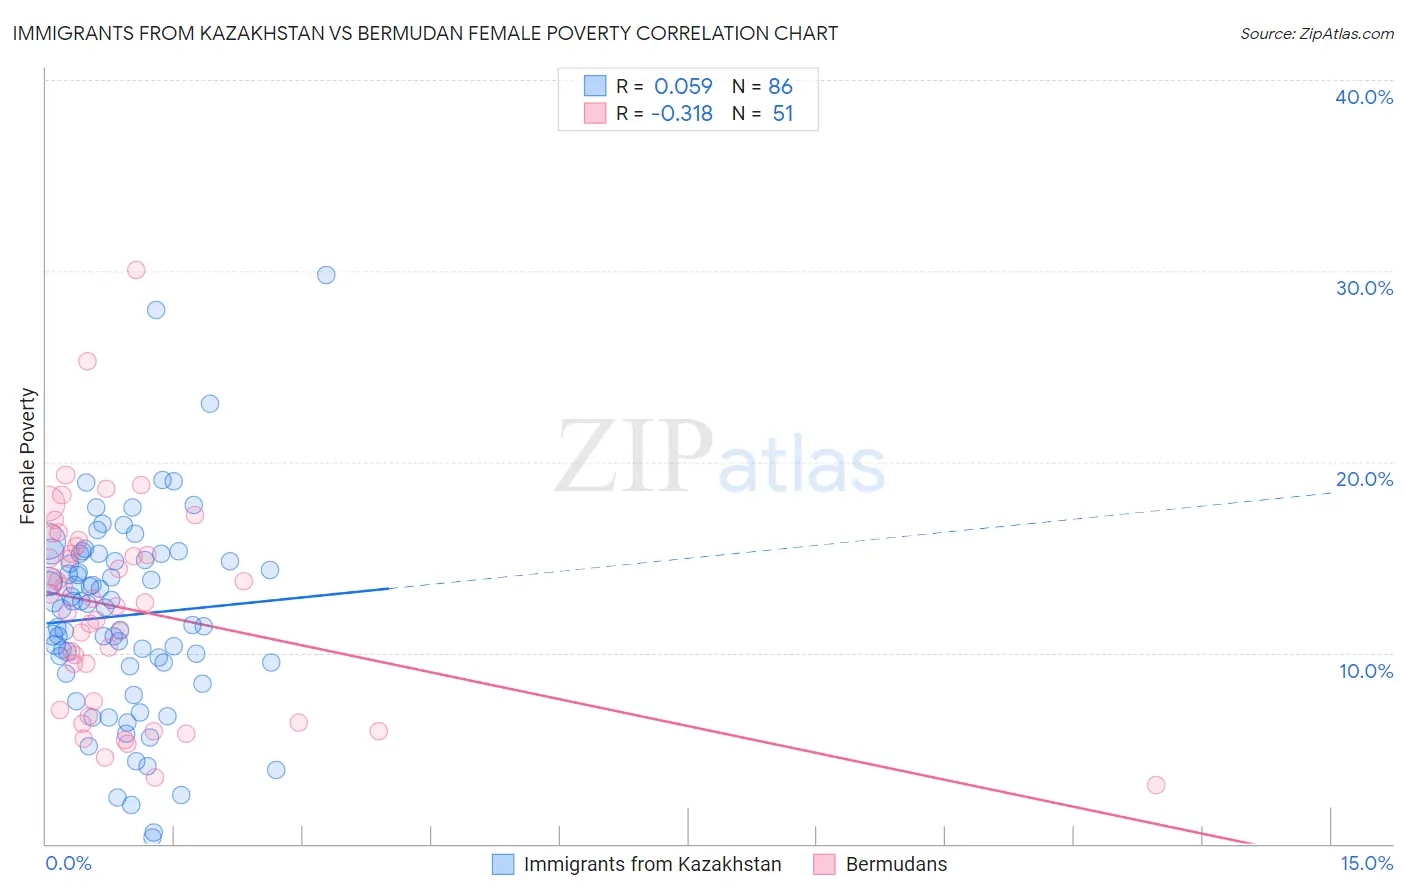
Immigrants from Kazakhstan vs Bermudan Female Poverty Correlation Chart
The statistical analysis conducted on geographies consisting of 124,418,226 people shows a slight positive correlation between the proportion of Immigrants from Kazakhstan and poverty level among females in the United States with a correlation coefficient (R) of 0.059 and weighted average of 13.0%. Similarly, the statistical analysis conducted on geographies consisting of 55,716,155 people shows a mild negative correlation between the proportion of Bermudans and poverty level among females in the United States with a correlation coefficient (R) of -0.318 and weighted average of 14.4%, a difference of 10.3%.
Female Poverty Correlation Summary
| Measurement | Immigrants from Kazakhstan | Bermudan |
| Minimum | 0.34% | 3.1% |
| Maximum | 29.8% | 30.0% |
| Range | 29.4% | 26.9% |
| Mean | 11.9% | 12.3% |
| Median | 12.5% | 12.6% |
| Interquartile 25% (IQ1) | 9.5% | 7.0% |
| Interquartile 75% (IQ3) | 14.9% | 15.6% |
| Interquartile Range (IQR) | 5.4% | 8.5% |
| Standard Deviation (Sample) | 5.2% | 5.5% |
| Standard Deviation (Population) | 5.2% | 5.5% |
Similar Demographics by Female Poverty
Demographics Similar to Immigrants from Kazakhstan by Female Poverty
In terms of female poverty, the demographic groups most similar to Immigrants from Kazakhstan are Immigrants from Peru (13.0%, a difference of 0.080%), Syrian (13.0%, a difference of 0.16%), Afghan (13.0%, a difference of 0.18%), Yugoslavian (13.1%, a difference of 0.25%), and Immigrants from Malaysia (13.0%, a difference of 0.27%).
| Demographics | Rating | Rank | Female Poverty |
| Pakistanis | 83.0 /100 | #140 | Excellent 12.9% |
| Icelanders | 81.1 /100 | #141 | Excellent 13.0% |
| Brazilians | 80.5 /100 | #142 | Excellent 13.0% |
| Immigrants | Malaysia | 80.4 /100 | #143 | Excellent 13.0% |
| Afghans | 79.8 /100 | #144 | Good 13.0% |
| Syrians | 79.6 /100 | #145 | Good 13.0% |
| Immigrants | Peru | 79.1 /100 | #146 | Good 13.0% |
| Immigrants | Kazakhstan | 78.6 /100 | #147 | Good 13.0% |
| Yugoslavians | 76.9 /100 | #148 | Good 13.1% |
| Taiwanese | 75.7 /100 | #149 | Good 13.1% |
| Tsimshian | 75.5 /100 | #150 | Good 13.1% |
| Immigrants | Germany | 74.9 /100 | #151 | Good 13.1% |
| Samoans | 73.6 /100 | #152 | Good 13.1% |
| Immigrants | Fiji | 71.0 /100 | #153 | Good 13.2% |
| Armenians | 70.4 /100 | #154 | Good 13.2% |
Demographics Similar to Bermudans by Female Poverty
In terms of female poverty, the demographic groups most similar to Bermudans are Alaskan Athabascan (14.4%, a difference of 0.080%), Marshallese (14.4%, a difference of 0.24%), Immigrants from Panama (14.4%, a difference of 0.39%), Immigrants from Thailand (14.4%, a difference of 0.47%), and Immigrants (14.4%, a difference of 0.51%).
| Demographics | Rating | Rank | Female Poverty |
| Ugandans | 15.4 /100 | #205 | Poor 14.0% |
| Immigrants | Uruguay | 14.0 /100 | #206 | Poor 14.0% |
| Immigrants | Eastern Africa | 9.0 /100 | #207 | Tragic 14.2% |
| Immigrants | Azores | 7.9 /100 | #208 | Tragic 14.2% |
| Panamanians | 7.7 /100 | #209 | Tragic 14.2% |
| Malaysians | 7.4 /100 | #210 | Tragic 14.3% |
| Moroccans | 7.2 /100 | #211 | Tragic 14.3% |
| Bermudans | 5.5 /100 | #212 | Tragic 14.4% |
| Alaskan Athabascans | 5.3 /100 | #213 | Tragic 14.4% |
| Marshallese | 5.0 /100 | #214 | Tragic 14.4% |
| Immigrants | Panama | 4.7 /100 | #215 | Tragic 14.4% |
| Immigrants | Thailand | 4.5 /100 | #216 | Tragic 14.4% |
| Immigrants | Immigrants | 4.5 /100 | #217 | Tragic 14.4% |
| Immigrants | Uzbekistan | 4.4 /100 | #218 | Tragic 14.4% |
| Japanese | 4.1 /100 | #219 | Tragic 14.5% |