Immigrants from Kazakhstan vs Immigrants from Oceania Self-Care Disability
COMPARE
Immigrants from Kazakhstan
Immigrants from Oceania
Self-Care Disability
Self-Care Disability Comparison
Immigrants from Kazakhstan
Immigrants from Oceania
2.5%
SELF-CARE DISABILITY
46.7/ 100
METRIC RATING
177th/ 347
METRIC RANK
2.5%
SELF-CARE DISABILITY
28.3/ 100
METRIC RATING
188th/ 347
METRIC RANK
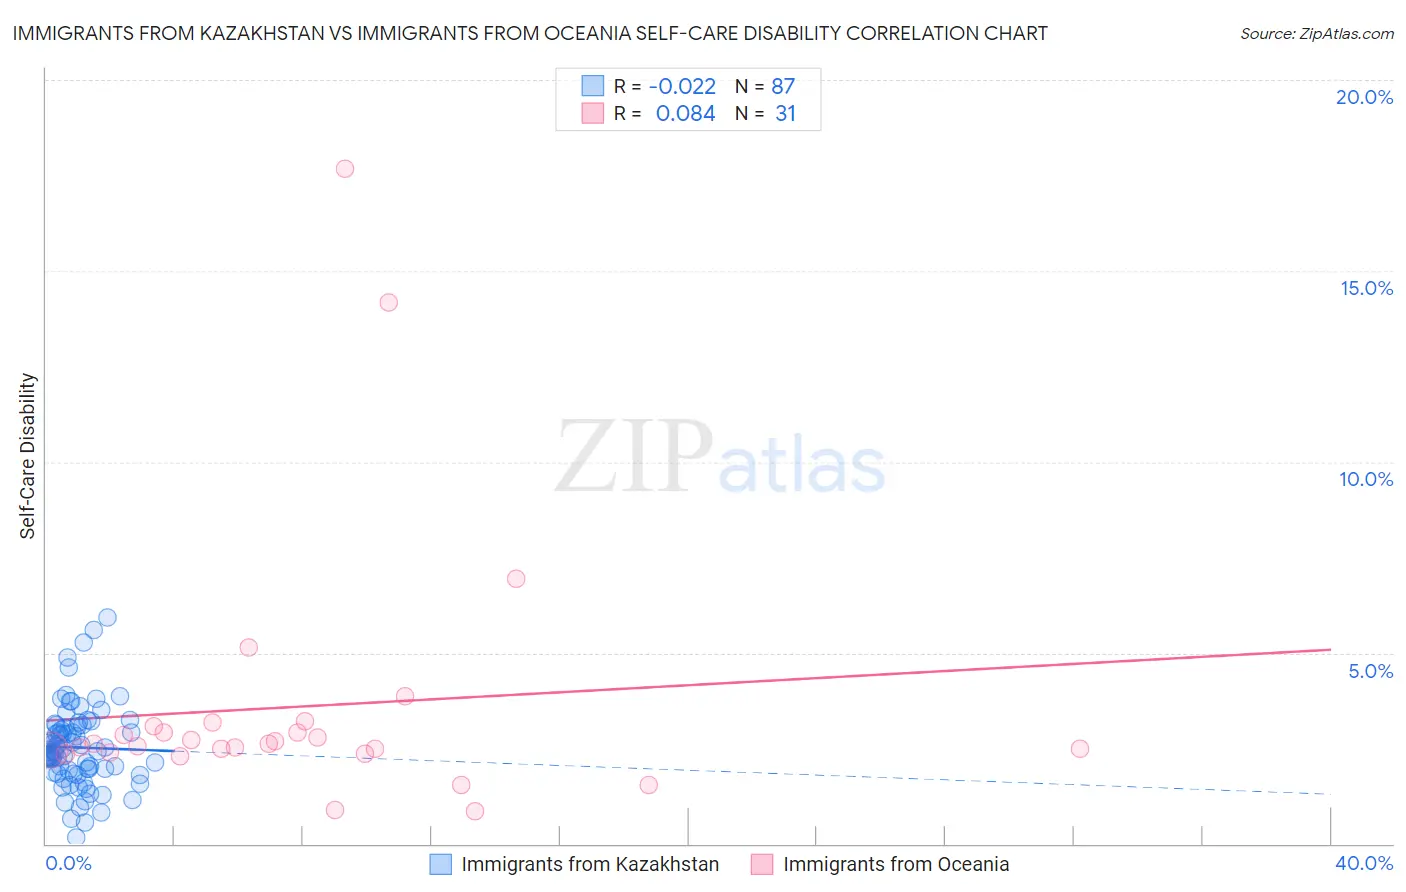
Immigrants from Kazakhstan vs Immigrants from Oceania Self-Care Disability Correlation Chart
The statistical analysis conducted on geographies consisting of 124,334,513 people shows no correlation between the proportion of Immigrants from Kazakhstan and percentage of population with self-care disability in the United States with a correlation coefficient (R) of -0.022 and weighted average of 2.5%. Similarly, the statistical analysis conducted on geographies consisting of 305,144,146 people shows a slight positive correlation between the proportion of Immigrants from Oceania and percentage of population with self-care disability in the United States with a correlation coefficient (R) of 0.084 and weighted average of 2.5%, a difference of 0.95%.
Self-Care Disability Correlation Summary
| Measurement | Immigrants from Kazakhstan | Immigrants from Oceania |
| Minimum | 0.18% | 0.86% |
| Maximum | 5.9% | 17.7% |
| Range | 5.7% | 16.8% |
| Mean | 2.5% | 3.6% |
| Median | 2.4% | 2.6% |
| Interquartile 25% (IQ1) | 1.9% | 2.4% |
| Interquartile 75% (IQ3) | 3.1% | 3.1% |
| Interquartile Range (IQR) | 1.2% | 0.68% |
| Standard Deviation (Sample) | 1.1% | 3.5% |
| Standard Deviation (Population) | 1.1% | 3.4% |
Demographics Similar to Immigrants from Kazakhstan and Immigrants from Oceania by Self-Care Disability
In terms of self-care disability, the demographic groups most similar to Immigrants from Kazakhstan are English (2.5%, a difference of 0.020%), Immigrants from Afghanistan (2.5%, a difference of 0.040%), Hungarian (2.5%, a difference of 0.060%), Immigrants from Bosnia and Herzegovina (2.5%, a difference of 0.14%), and Welsh (2.5%, a difference of 0.16%). Similarly, the demographic groups most similar to Immigrants from Oceania are Immigrants from Eastern Europe (2.5%, a difference of 0.010%), Irish (2.5%, a difference of 0.030%), Sioux (2.5%, a difference of 0.22%), Immigrants from El Salvador (2.5%, a difference of 0.26%), and Slavic (2.5%, a difference of 0.33%).
| Demographics | Rating | Rank | Self-Care Disability |
| Czechoslovakians | 53.5 /100 | #172 | Average 2.5% |
| Immigrants | Burma/Myanmar | 52.8 /100 | #173 | Average 2.5% |
| Welsh | 50.0 /100 | #174 | Average 2.5% |
| Immigrants | Bosnia and Herzegovina | 49.6 /100 | #175 | Average 2.5% |
| Immigrants | Afghanistan | 47.6 /100 | #176 | Average 2.5% |
| Immigrants | Kazakhstan | 46.7 /100 | #177 | Average 2.5% |
| English | 46.2 /100 | #178 | Average 2.5% |
| Hungarians | 45.5 /100 | #179 | Average 2.5% |
| Indonesians | 41.2 /100 | #180 | Average 2.5% |
| Ghanaians | 40.4 /100 | #181 | Average 2.5% |
| Maltese | 37.5 /100 | #182 | Fair 2.5% |
| Salvadorans | 36.4 /100 | #183 | Fair 2.5% |
| Yugoslavians | 36.1 /100 | #184 | Fair 2.5% |
| Slavs | 34.3 /100 | #185 | Fair 2.5% |
| Immigrants | El Salvador | 33.0 /100 | #186 | Fair 2.5% |
| Irish | 28.7 /100 | #187 | Fair 2.5% |
| Immigrants | Oceania | 28.3 /100 | #188 | Fair 2.5% |
| Immigrants | Eastern Europe | 28.0 /100 | #189 | Fair 2.5% |
| Sioux | 24.6 /100 | #190 | Fair 2.5% |
| Moroccans | 22.9 /100 | #191 | Fair 2.5% |
| Soviet Union | 22.2 /100 | #192 | Fair 2.5% |