Immigrants from Kazakhstan vs Swedish Female Poverty
COMPARE
Immigrants from Kazakhstan
Swedish
Female Poverty
Female Poverty Comparison
Immigrants from Kazakhstan
Swedes
13.0%
FEMALE POVERTY
78.6/ 100
METRIC RATING
147th/ 347
METRIC RANK
11.6%
FEMALE POVERTY
99.7/ 100
METRIC RATING
22nd/ 347
METRIC RANK
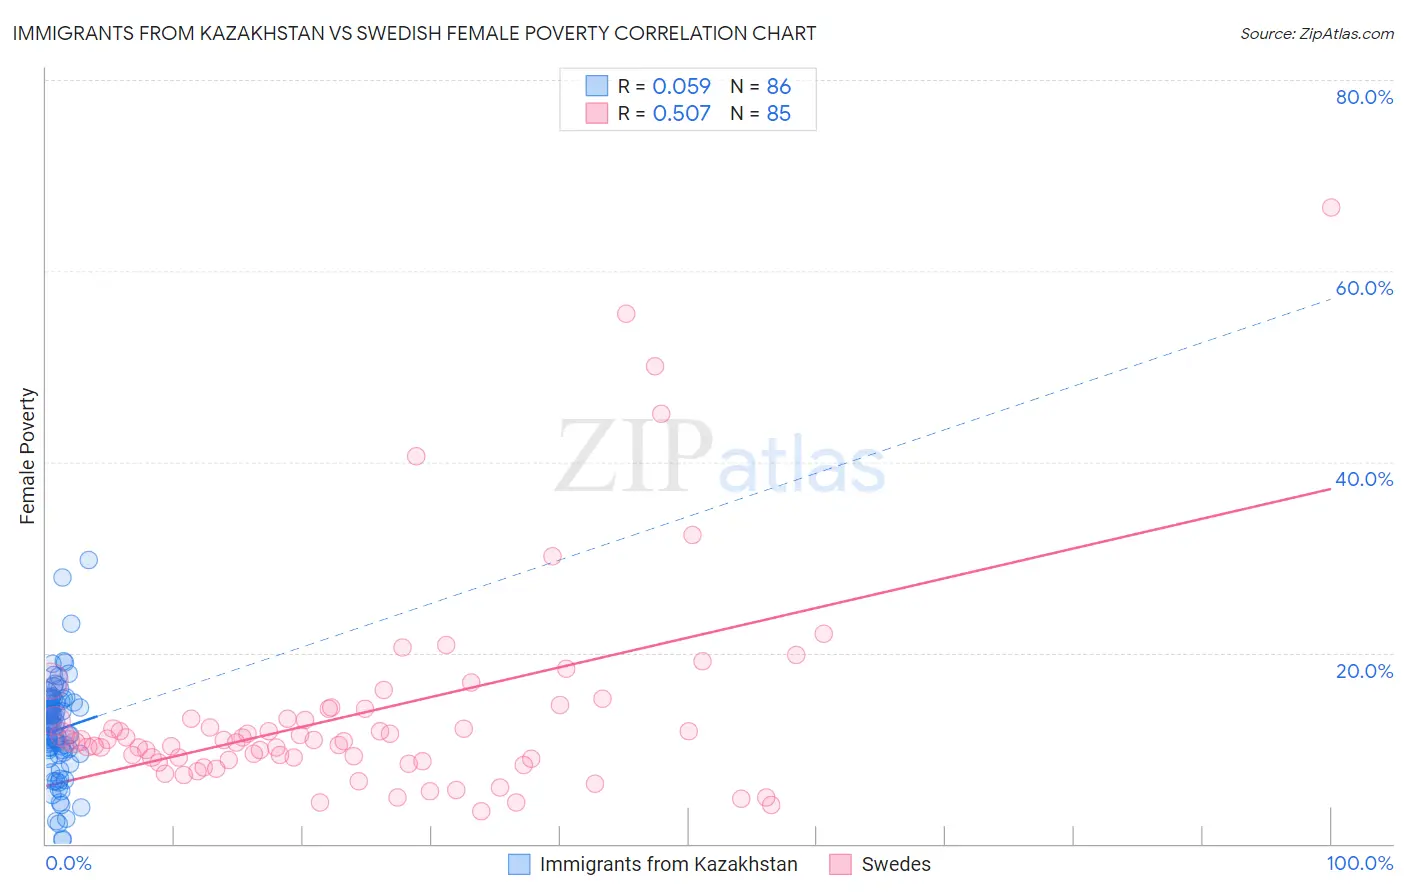
Immigrants from Kazakhstan vs Swedish Female Poverty Correlation Chart
The statistical analysis conducted on geographies consisting of 124,418,226 people shows a slight positive correlation between the proportion of Immigrants from Kazakhstan and poverty level among females in the United States with a correlation coefficient (R) of 0.059 and weighted average of 13.0%. Similarly, the statistical analysis conducted on geographies consisting of 538,313,222 people shows a substantial positive correlation between the proportion of Swedes and poverty level among females in the United States with a correlation coefficient (R) of 0.507 and weighted average of 11.6%, a difference of 12.3%.
Female Poverty Correlation Summary
| Measurement | Immigrants from Kazakhstan | Swedish |
| Minimum | 0.34% | 3.4% |
| Maximum | 29.8% | 66.7% |
| Range | 29.4% | 63.3% |
| Mean | 11.9% | 13.6% |
| Median | 12.5% | 10.8% |
| Interquartile 25% (IQ1) | 9.5% | 8.7% |
| Interquartile 75% (IQ3) | 14.9% | 13.6% |
| Interquartile Range (IQR) | 5.4% | 5.0% |
| Standard Deviation (Sample) | 5.2% | 11.0% |
| Standard Deviation (Population) | 5.2% | 10.9% |
Similar Demographics by Female Poverty
Demographics Similar to Immigrants from Kazakhstan by Female Poverty
In terms of female poverty, the demographic groups most similar to Immigrants from Kazakhstan are Immigrants from Peru (13.0%, a difference of 0.080%), Syrian (13.0%, a difference of 0.16%), Afghan (13.0%, a difference of 0.18%), Yugoslavian (13.1%, a difference of 0.25%), and Immigrants from Malaysia (13.0%, a difference of 0.27%).
| Demographics | Rating | Rank | Female Poverty |
| Pakistanis | 83.0 /100 | #140 | Excellent 12.9% |
| Icelanders | 81.1 /100 | #141 | Excellent 13.0% |
| Brazilians | 80.5 /100 | #142 | Excellent 13.0% |
| Immigrants | Malaysia | 80.4 /100 | #143 | Excellent 13.0% |
| Afghans | 79.8 /100 | #144 | Good 13.0% |
| Syrians | 79.6 /100 | #145 | Good 13.0% |
| Immigrants | Peru | 79.1 /100 | #146 | Good 13.0% |
| Immigrants | Kazakhstan | 78.6 /100 | #147 | Good 13.0% |
| Yugoslavians | 76.9 /100 | #148 | Good 13.1% |
| Taiwanese | 75.7 /100 | #149 | Good 13.1% |
| Tsimshian | 75.5 /100 | #150 | Good 13.1% |
| Immigrants | Germany | 74.9 /100 | #151 | Good 13.1% |
| Samoans | 73.6 /100 | #152 | Good 13.1% |
| Immigrants | Fiji | 71.0 /100 | #153 | Good 13.2% |
| Armenians | 70.4 /100 | #154 | Good 13.2% |
Demographics Similar to Swedes by Female Poverty
In terms of female poverty, the demographic groups most similar to Swedes are Italian (11.6%, a difference of 0.030%), Burmese (11.6%, a difference of 0.14%), Luxembourger (11.6%, a difference of 0.16%), Immigrants from Northern Europe (11.6%, a difference of 0.42%), and Croatian (11.6%, a difference of 0.43%).
| Demographics | Rating | Rank | Female Poverty |
| Latvians | 99.8 /100 | #15 | Exceptional 11.4% |
| Immigrants | Bolivia | 99.8 /100 | #16 | Exceptional 11.5% |
| Bolivians | 99.8 /100 | #17 | Exceptional 11.5% |
| Immigrants | Scotland | 99.8 /100 | #18 | Exceptional 11.5% |
| Norwegians | 99.8 /100 | #19 | Exceptional 11.5% |
| Eastern Europeans | 99.7 /100 | #20 | Exceptional 11.5% |
| Italians | 99.7 /100 | #21 | Exceptional 11.6% |
| Swedes | 99.7 /100 | #22 | Exceptional 11.6% |
| Burmese | 99.7 /100 | #23 | Exceptional 11.6% |
| Luxembourgers | 99.7 /100 | #24 | Exceptional 11.6% |
| Immigrants | Northern Europe | 99.6 /100 | #25 | Exceptional 11.6% |
| Croatians | 99.6 /100 | #26 | Exceptional 11.6% |
| Iranians | 99.6 /100 | #27 | Exceptional 11.7% |
| Immigrants | Korea | 99.6 /100 | #28 | Exceptional 11.7% |
| Immigrants | North Macedonia | 99.6 /100 | #29 | Exceptional 11.7% |