Immigrants from West Indies vs Immigrants from Oceania Female Poverty
COMPARE
Immigrants from West Indies
Immigrants from Oceania
Female Poverty
Female Poverty Comparison
Immigrants from West Indies
Immigrants from Oceania
16.1%
FEMALE POVERTY
0.0/ 100
METRIC RATING
278th/ 347
METRIC RANK
13.3%
FEMALE POVERTY
59.7/ 100
METRIC RATING
166th/ 347
METRIC RANK
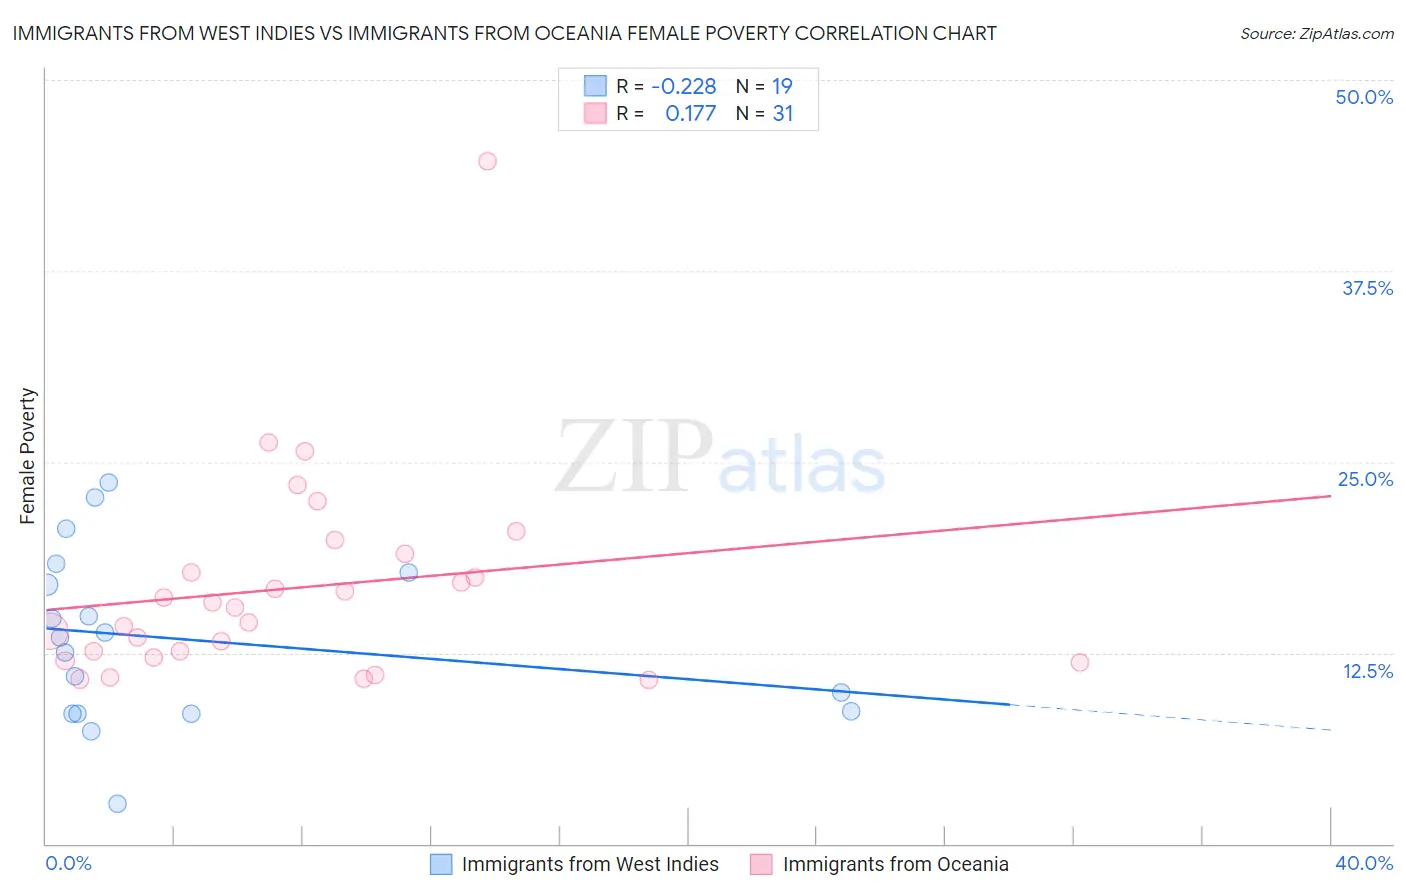
Immigrants from West Indies vs Immigrants from Oceania Female Poverty Correlation Chart
The statistical analysis conducted on geographies consisting of 72,454,628 people shows a weak negative correlation between the proportion of Immigrants from West Indies and poverty level among females in the United States with a correlation coefficient (R) of -0.228 and weighted average of 16.1%. Similarly, the statistical analysis conducted on geographies consisting of 305,339,012 people shows a poor positive correlation between the proportion of Immigrants from Oceania and poverty level among females in the United States with a correlation coefficient (R) of 0.177 and weighted average of 13.3%, a difference of 20.6%.
Female Poverty Correlation Summary
| Measurement | Immigrants from West Indies | Immigrants from Oceania |
| Minimum | 2.6% | 10.7% |
| Maximum | 23.6% | 44.6% |
| Range | 21.0% | 33.9% |
| Mean | 13.4% | 16.8% |
| Median | 13.5% | 15.5% |
| Interquartile 25% (IQ1) | 8.5% | 12.2% |
| Interquartile 75% (IQ3) | 17.7% | 19.0% |
| Interquartile Range (IQR) | 9.2% | 6.8% |
| Standard Deviation (Sample) | 5.6% | 6.8% |
| Standard Deviation (Population) | 5.5% | 6.7% |
Similar Demographics by Female Poverty
Demographics Similar to Immigrants from West Indies by Female Poverty
In terms of female poverty, the demographic groups most similar to Immigrants from West Indies are Immigrants from Bahamas (16.1%, a difference of 0.12%), Bangladeshi (16.0%, a difference of 0.31%), Vietnamese (16.1%, a difference of 0.35%), West Indian (16.1%, a difference of 0.37%), and Central American (16.0%, a difference of 0.50%).
| Demographics | Rating | Rank | Female Poverty |
| Immigrants | St. Vincent and the Grenadines | 0.0 /100 | #271 | Tragic 15.9% |
| Belizeans | 0.0 /100 | #272 | Tragic 15.9% |
| Haitians | 0.0 /100 | #273 | Tragic 15.9% |
| Barbadians | 0.0 /100 | #274 | Tragic 15.9% |
| Immigrants | Barbados | 0.0 /100 | #275 | Tragic 16.0% |
| Central Americans | 0.0 /100 | #276 | Tragic 16.0% |
| Bangladeshis | 0.0 /100 | #277 | Tragic 16.0% |
| Immigrants | West Indies | 0.0 /100 | #278 | Tragic 16.1% |
| Immigrants | Bahamas | 0.0 /100 | #279 | Tragic 16.1% |
| Vietnamese | 0.0 /100 | #280 | Tragic 16.1% |
| West Indians | 0.0 /100 | #281 | Tragic 16.1% |
| Immigrants | Haiti | 0.0 /100 | #282 | Tragic 16.1% |
| Immigrants | Cuba | 0.0 /100 | #283 | Tragic 16.1% |
| Spanish Americans | 0.0 /100 | #284 | Tragic 16.2% |
| Comanche | 0.0 /100 | #285 | Tragic 16.2% |
Demographics Similar to Immigrants from Oceania by Female Poverty
In terms of female poverty, the demographic groups most similar to Immigrants from Oceania are Scotch-Irish (13.3%, a difference of 0.24%), Immigrants from Chile (13.3%, a difference of 0.24%), Ethiopian (13.3%, a difference of 0.26%), Guamanian/Chamorro (13.3%, a difference of 0.27%), and Immigrants from Albania (13.3%, a difference of 0.27%).
| Demographics | Rating | Rank | Female Poverty |
| Costa Ricans | 63.6 /100 | #159 | Good 13.3% |
| Immigrants | Nepal | 62.7 /100 | #160 | Good 13.3% |
| Immigrants | Ethiopia | 62.5 /100 | #161 | Good 13.3% |
| Guamanians/Chamorros | 62.4 /100 | #162 | Good 13.3% |
| Immigrants | Albania | 62.4 /100 | #163 | Good 13.3% |
| Ethiopians | 62.3 /100 | #164 | Good 13.3% |
| Scotch-Irish | 62.1 /100 | #165 | Good 13.3% |
| Immigrants | Oceania | 59.7 /100 | #166 | Average 13.3% |
| Immigrants | Chile | 57.4 /100 | #167 | Average 13.3% |
| Aleuts | 56.7 /100 | #168 | Average 13.4% |
| Lebanese | 55.9 /100 | #169 | Average 13.4% |
| Colombians | 55.7 /100 | #170 | Average 13.4% |
| Whites/Caucasians | 54.6 /100 | #171 | Average 13.4% |
| Mongolians | 53.6 /100 | #172 | Average 13.4% |
| Immigrants | Afghanistan | 50.8 /100 | #173 | Average 13.4% |