Immigrants from Kazakhstan vs South African Female Poverty
COMPARE
Immigrants from Kazakhstan
South African
Female Poverty
Female Poverty Comparison
Immigrants from Kazakhstan
South Africans
13.0%
FEMALE POVERTY
78.6/ 100
METRIC RATING
147th/ 347
METRIC RANK
12.8%
FEMALE POVERTY
88.4/ 100
METRIC RATING
127th/ 347
METRIC RANK
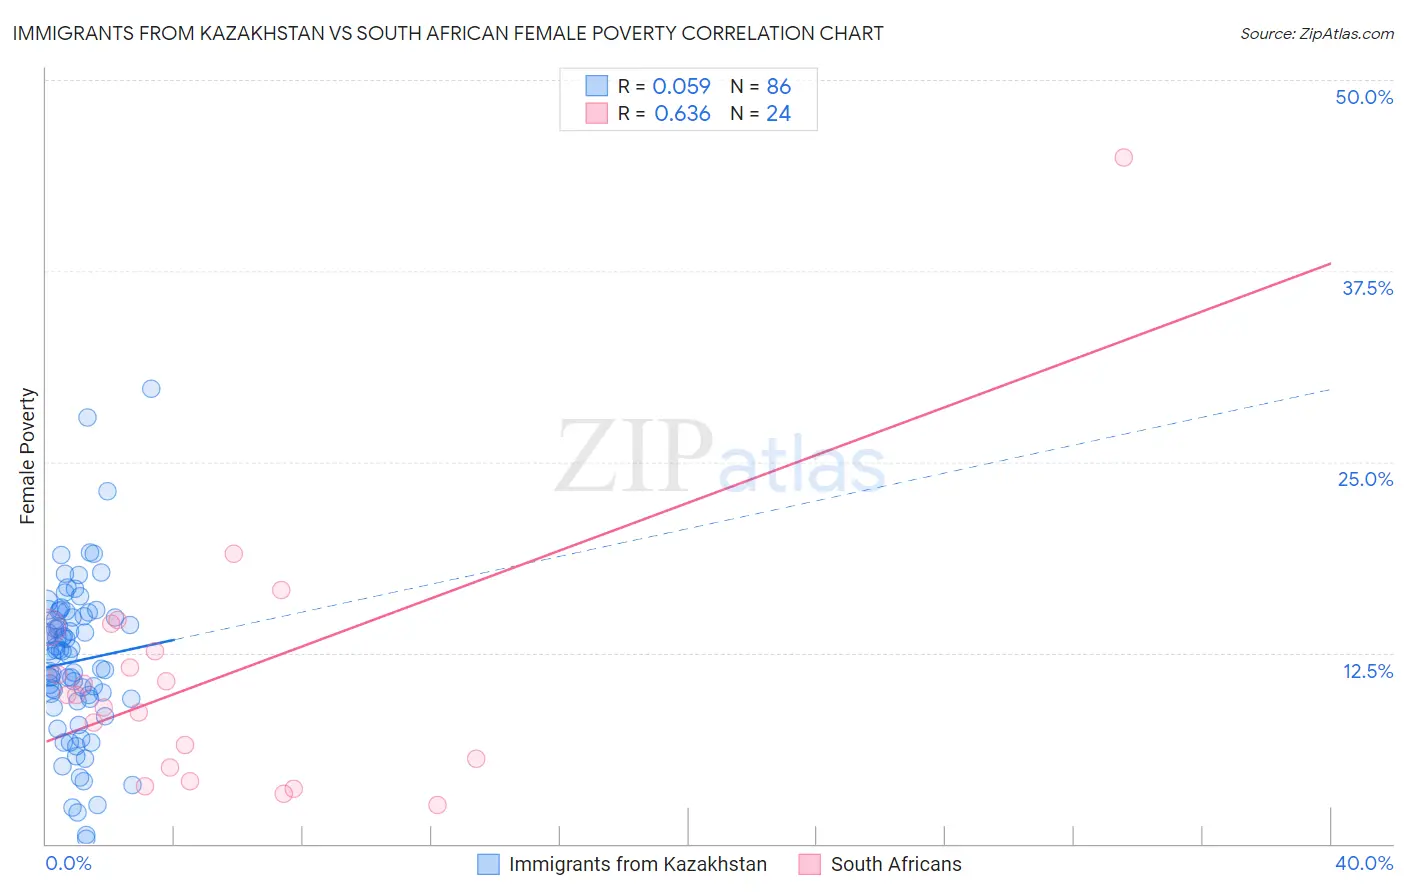
Immigrants from Kazakhstan vs South African Female Poverty Correlation Chart
The statistical analysis conducted on geographies consisting of 124,418,226 people shows a slight positive correlation between the proportion of Immigrants from Kazakhstan and poverty level among females in the United States with a correlation coefficient (R) of 0.059 and weighted average of 13.0%. Similarly, the statistical analysis conducted on geographies consisting of 182,540,648 people shows a significant positive correlation between the proportion of South Africans and poverty level among females in the United States with a correlation coefficient (R) of 0.636 and weighted average of 12.8%, a difference of 1.8%.
Female Poverty Correlation Summary
| Measurement | Immigrants from Kazakhstan | South African |
| Minimum | 0.34% | 2.6% |
| Maximum | 29.8% | 44.9% |
| Range | 29.4% | 42.4% |
| Mean | 11.9% | 10.8% |
| Median | 12.5% | 9.7% |
| Interquartile 25% (IQ1) | 9.5% | 5.3% |
| Interquartile 75% (IQ3) | 14.9% | 13.4% |
| Interquartile Range (IQR) | 5.4% | 8.1% |
| Standard Deviation (Sample) | 5.2% | 8.5% |
| Standard Deviation (Population) | 5.2% | 8.4% |
Demographics Similar to Immigrants from Kazakhstan and South Africans by Female Poverty
In terms of female poverty, the demographic groups most similar to Immigrants from Kazakhstan are Immigrants from Peru (13.0%, a difference of 0.080%), Syrian (13.0%, a difference of 0.16%), Afghan (13.0%, a difference of 0.18%), Immigrants from Malaysia (13.0%, a difference of 0.27%), and Brazilian (13.0%, a difference of 0.30%). Similarly, the demographic groups most similar to South Africans are Immigrants from Belarus (12.8%, a difference of 0.040%), Immigrants from Brazil (12.8%, a difference of 0.11%), Immigrants from Vietnam (12.8%, a difference of 0.30%), Immigrants from Argentina (12.8%, a difference of 0.33%), and Immigrants from Jordan (12.8%, a difference of 0.35%).
| Demographics | Rating | Rank | Female Poverty |
| South Africans | 88.4 /100 | #127 | Excellent 12.8% |
| Immigrants | Belarus | 88.2 /100 | #128 | Excellent 12.8% |
| Immigrants | Brazil | 87.9 /100 | #129 | Excellent 12.8% |
| Immigrants | Vietnam | 87.1 /100 | #130 | Excellent 12.8% |
| Immigrants | Argentina | 87.0 /100 | #131 | Excellent 12.8% |
| Immigrants | Jordan | 86.9 /100 | #132 | Excellent 12.8% |
| Immigrants | Western Europe | 86.6 /100 | #133 | Excellent 12.8% |
| Immigrants | Switzerland | 85.8 /100 | #134 | Excellent 12.9% |
| French | 85.6 /100 | #135 | Excellent 12.9% |
| Peruvians | 85.2 /100 | #136 | Excellent 12.9% |
| Chileans | 84.7 /100 | #137 | Excellent 12.9% |
| Immigrants | France | 83.6 /100 | #138 | Excellent 12.9% |
| Basques | 83.1 /100 | #139 | Excellent 12.9% |
| Pakistanis | 83.0 /100 | #140 | Excellent 12.9% |
| Icelanders | 81.1 /100 | #141 | Excellent 13.0% |
| Brazilians | 80.5 /100 | #142 | Excellent 13.0% |
| Immigrants | Malaysia | 80.4 /100 | #143 | Excellent 13.0% |
| Afghans | 79.8 /100 | #144 | Good 13.0% |
| Syrians | 79.6 /100 | #145 | Good 13.0% |
| Immigrants | Peru | 79.1 /100 | #146 | Good 13.0% |
| Immigrants | Kazakhstan | 78.6 /100 | #147 | Good 13.0% |