Hmong vs German Russian Married-Couple Family Poverty
COMPARE
Hmong
German Russian
Married-Couple Family Poverty
Married-Couple Family Poverty Comparison
Hmong
German Russians
5.0%
MARRIED-COUPLE FAMILY POVERTY
83.2/ 100
METRIC RATING
144th/ 347
METRIC RANK
5.0%
MARRIED-COUPLE FAMILY POVERTY
85.1/ 100
METRIC RATING
139th/ 347
METRIC RANK
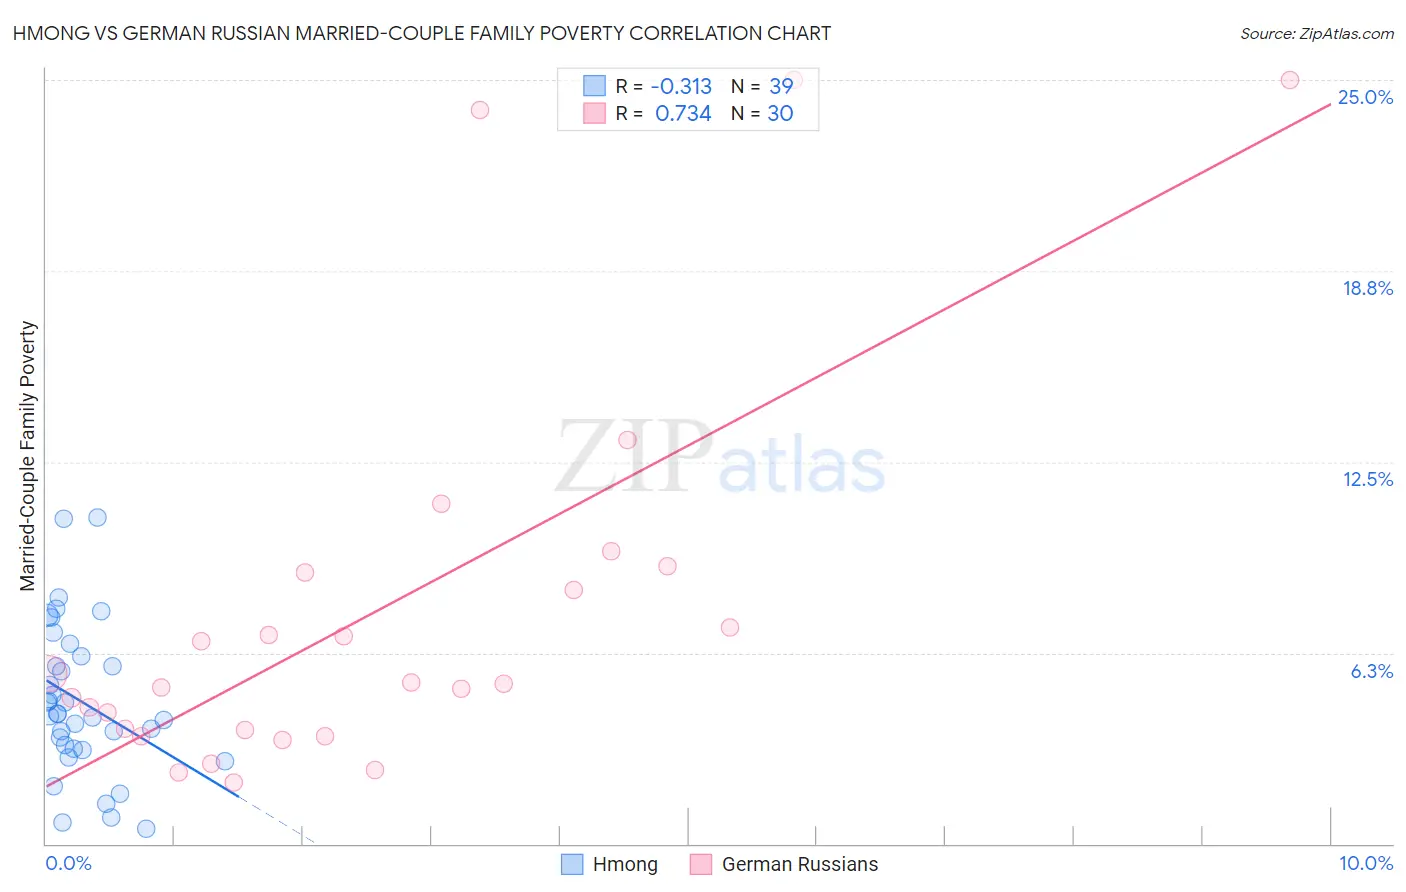
Hmong vs German Russian Married-Couple Family Poverty Correlation Chart
The statistical analysis conducted on geographies consisting of 24,678,157 people shows a mild negative correlation between the proportion of Hmong and poverty level among married-couple families in the United States with a correlation coefficient (R) of -0.313 and weighted average of 5.0%. Similarly, the statistical analysis conducted on geographies consisting of 96,237,761 people shows a strong positive correlation between the proportion of German Russians and poverty level among married-couple families in the United States with a correlation coefficient (R) of 0.734 and weighted average of 5.0%, a difference of 0.43%.
Married-Couple Family Poverty Correlation Summary
| Measurement | Hmong | German Russian |
| Minimum | 0.50% | 2.0% |
| Maximum | 10.7% | 25.0% |
| Range | 10.2% | 23.0% |
| Mean | 4.7% | 7.6% |
| Median | 4.3% | 5.3% |
| Interquartile 25% (IQ1) | 3.1% | 3.7% |
| Interquartile 75% (IQ3) | 6.1% | 8.9% |
| Interquartile Range (IQR) | 3.0% | 5.1% |
| Standard Deviation (Sample) | 2.4% | 6.4% |
| Standard Deviation (Population) | 2.4% | 6.3% |
Demographics Similar to Hmong and German Russians by Married-Couple Family Poverty
In terms of married-couple family poverty, the demographic groups most similar to Hmong are Immigrants from Egypt (5.0%, a difference of 0.050%), Immigrants from Brazil (5.0%, a difference of 0.32%), Immigrants from China (5.0%, a difference of 0.32%), Immigrants from Portugal (5.0%, a difference of 0.37%), and Chilean (4.9%, a difference of 0.66%). Similarly, the demographic groups most similar to German Russians are Immigrants from Portugal (5.0%, a difference of 0.060%), Immigrants from Brazil (5.0%, a difference of 0.11%), Immigrants from China (5.0%, a difference of 0.11%), Chilean (4.9%, a difference of 0.23%), and Guamanian/Chamorro (4.9%, a difference of 0.36%).
| Demographics | Rating | Rank | Married-Couple Family Poverty |
| Immigrants | Eastern Europe | 90.5 /100 | #131 | Exceptional 4.9% |
| Puget Sound Salish | 90.4 /100 | #132 | Exceptional 4.9% |
| Immigrants | Kenya | 90.2 /100 | #133 | Exceptional 4.9% |
| Samoans | 90.2 /100 | #134 | Exceptional 4.9% |
| Assyrians/Chaldeans/Syriacs | 89.4 /100 | #135 | Excellent 4.9% |
| Immigrants | Hungary | 88.7 /100 | #136 | Excellent 4.9% |
| Guamanians/Chamorros | 86.5 /100 | #137 | Excellent 4.9% |
| Chileans | 86.0 /100 | #138 | Excellent 4.9% |
| German Russians | 85.1 /100 | #139 | Excellent 5.0% |
| Immigrants | Portugal | 84.8 /100 | #140 | Excellent 5.0% |
| Immigrants | Brazil | 84.6 /100 | #141 | Excellent 5.0% |
| Immigrants | China | 84.6 /100 | #142 | Excellent 5.0% |
| Immigrants | Egypt | 83.4 /100 | #143 | Excellent 5.0% |
| Hmong | 83.2 /100 | #144 | Excellent 5.0% |
| Immigrants | Spain | 79.9 /100 | #145 | Good 5.0% |
| Mongolians | 79.8 /100 | #146 | Good 5.0% |
| Syrians | 78.7 /100 | #147 | Good 5.0% |
| Immigrants | Russia | 78.7 /100 | #148 | Good 5.0% |
| Immigrants | Oceania | 78.6 /100 | #149 | Good 5.0% |
| Brazilians | 78.3 /100 | #150 | Good 5.0% |
| Immigrants | Cameroon | 77.3 /100 | #151 | Good 5.0% |