Hmong vs Immigrants from Sudan 10th Grade
COMPARE
Hmong
Immigrants from Sudan
10th Grade
10th Grade Comparison
Hmong
Immigrants from Sudan
94.1%
10TH GRADE
86.6/ 100
METRIC RATING
141st/ 347
METRIC RANK
93.4%
10TH GRADE
20.0/ 100
METRIC RATING
206th/ 347
METRIC RANK
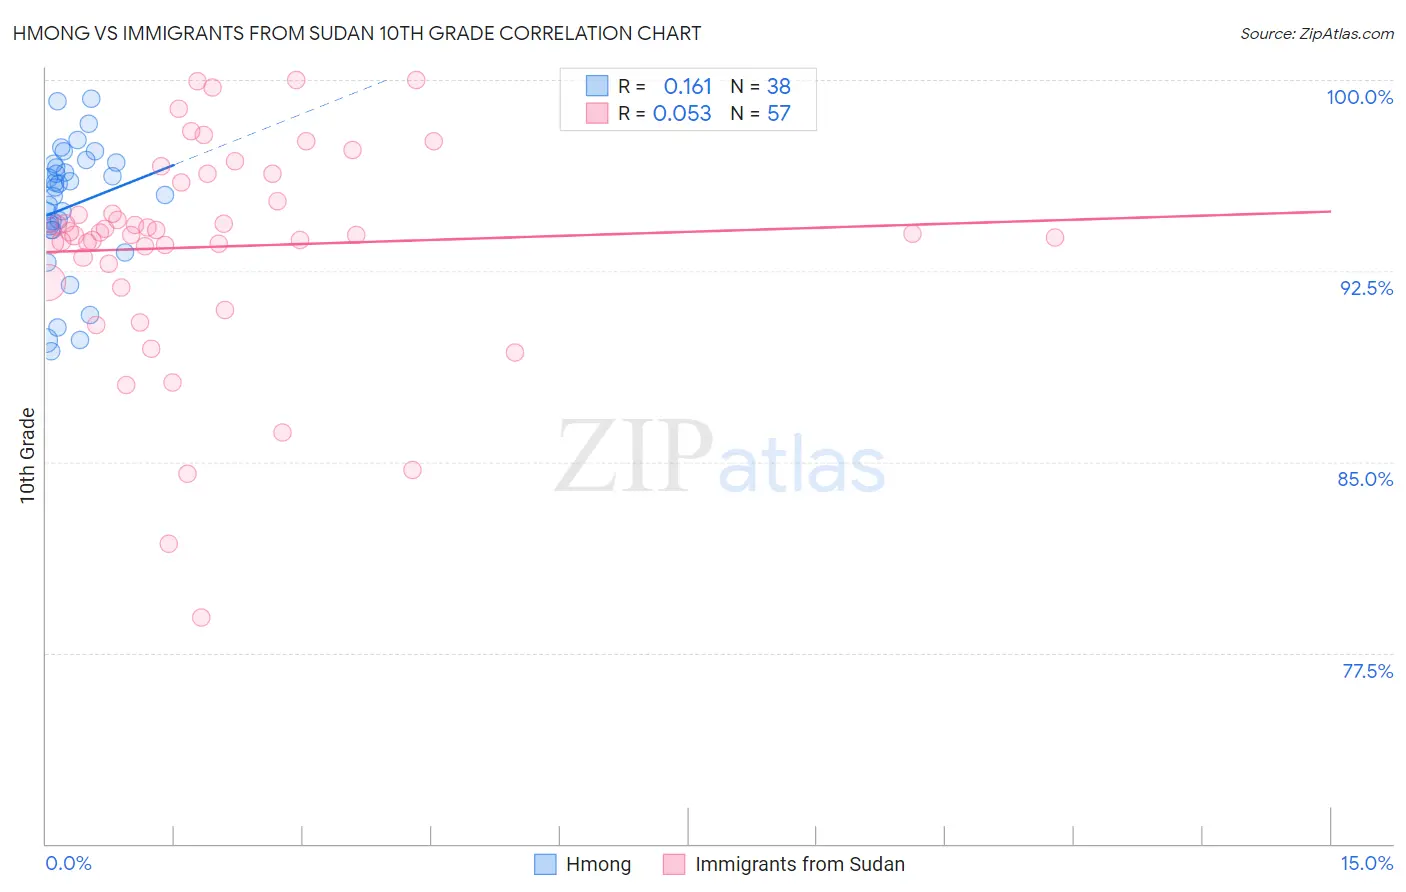
Hmong vs Immigrants from Sudan 10th Grade Correlation Chart
The statistical analysis conducted on geographies consisting of 24,672,093 people shows a poor positive correlation between the proportion of Hmong and percentage of population with at least 10th grade education in the United States with a correlation coefficient (R) of 0.161 and weighted average of 94.1%. Similarly, the statistical analysis conducted on geographies consisting of 118,959,807 people shows a slight positive correlation between the proportion of Immigrants from Sudan and percentage of population with at least 10th grade education in the United States with a correlation coefficient (R) of 0.053 and weighted average of 93.4%, a difference of 0.73%.
10th Grade Correlation Summary
| Measurement | Hmong | Immigrants from Sudan |
| Minimum | 89.3% | 78.9% |
| Maximum | 99.2% | 100.0% |
| Range | 9.9% | 21.1% |
| Mean | 95.0% | 93.5% |
| Median | 95.6% | 94.0% |
| Interquartile 25% (IQ1) | 94.1% | 92.4% |
| Interquartile 75% (IQ3) | 96.7% | 96.1% |
| Interquartile Range (IQR) | 2.6% | 3.7% |
| Standard Deviation (Sample) | 2.5% | 4.3% |
| Standard Deviation (Population) | 2.5% | 4.2% |
Similar Demographics by 10th Grade
Demographics Similar to Hmong by 10th Grade
In terms of 10th grade, the demographic groups most similar to Hmong are Albanian (94.1%, a difference of 0.0%), Immigrants from Jordan (94.1%, a difference of 0.020%), Cherokee (94.1%, a difference of 0.030%), Immigrants from Kazakhstan (94.1%, a difference of 0.030%), and Nonimmigrants (94.1%, a difference of 0.050%).
| Demographics | Rating | Rank | 10th Grade |
| Osage | 91.7 /100 | #134 | Exceptional 94.2% |
| Immigrants | Korea | 91.3 /100 | #135 | Exceptional 94.2% |
| Shoshone | 90.8 /100 | #136 | Exceptional 94.2% |
| Arapaho | 90.5 /100 | #137 | Exceptional 94.2% |
| Immigrants | Sri Lanka | 89.9 /100 | #138 | Excellent 94.2% |
| Immigrants | Bosnia and Herzegovina | 89.4 /100 | #139 | Excellent 94.2% |
| Immigrants | Jordan | 87.6 /100 | #140 | Excellent 94.1% |
| Hmong | 86.6 /100 | #141 | Excellent 94.1% |
| Albanians | 86.5 /100 | #142 | Excellent 94.1% |
| Cherokee | 84.9 /100 | #143 | Excellent 94.1% |
| Immigrants | Kazakhstan | 84.9 /100 | #144 | Excellent 94.1% |
| Immigrants | Nonimmigrants | 83.8 /100 | #145 | Excellent 94.1% |
| Chickasaw | 82.6 /100 | #146 | Excellent 94.1% |
| Immigrants | Ukraine | 81.5 /100 | #147 | Excellent 94.0% |
| Arabs | 80.9 /100 | #148 | Excellent 94.0% |
Demographics Similar to Immigrants from Sudan by 10th Grade
In terms of 10th grade, the demographic groups most similar to Immigrants from Sudan are Ute (93.4%, a difference of 0.0%), Immigrants from Indonesia (93.4%, a difference of 0.0%), Immigrants from Uganda (93.5%, a difference of 0.010%), Immigrants from Western Asia (93.4%, a difference of 0.010%), and Samoan (93.4%, a difference of 0.010%).
| Demographics | Rating | Rank | 10th Grade |
| Asians | 23.0 /100 | #199 | Fair 93.5% |
| Hopi | 22.2 /100 | #200 | Fair 93.5% |
| Hawaiians | 21.8 /100 | #201 | Fair 93.5% |
| Immigrants | Uganda | 20.9 /100 | #202 | Fair 93.5% |
| Immigrants | Western Asia | 20.6 /100 | #203 | Fair 93.4% |
| Ute | 20.3 /100 | #204 | Fair 93.4% |
| Immigrants | Indonesia | 20.2 /100 | #205 | Fair 93.4% |
| Immigrants | Sudan | 20.0 /100 | #206 | Fair 93.4% |
| Samoans | 19.5 /100 | #207 | Poor 93.4% |
| Immigrants | Syria | 19.4 /100 | #208 | Poor 93.4% |
| Immigrants | Chile | 18.8 /100 | #209 | Poor 93.4% |
| Indians (Asian) | 17.6 /100 | #210 | Poor 93.4% |
| Cajuns | 16.9 /100 | #211 | Poor 93.4% |
| Immigrants | Zaire | 16.7 /100 | #212 | Poor 93.4% |
| Immigrants | Asia | 15.7 /100 | #213 | Poor 93.4% |