Hmong vs Seminole Married-Couple Family Poverty

COMPARE

Hmong
Race
Ancestry
AfghanAfricanAlaska NativeAlaskan AthabascanAlbanianAleutAlsatianAmericanApacheArabArapahoArgentineanArmenianAssyrian/Chaldean/SyriacAustralianAustrianBahamianBangladeshiBarbadianBasqueBelgianBelizeanBermudanBhutaneseBlackfeetBolivianBrazilianBritishBritish West IndianBulgarianBurmeseCajunCambodianCanadianCape VerdeanCarpatho RusynCelticCentral AmericanCentral American IndianCherokeeCheyenneChickasawChileanChineseChippewaChoctawColombianColvilleComancheCosta RicanCreeCreekCroatianCrowCubanCypriotCzechCzechoslovakianDanishDelawareDominicanDutchDutch West IndianEastern EuropeanEcuadorianEgyptianEnglishEstonianEthiopianEuropeanFijianFilipinoFinnishFrenchFrench American IndianFrench CanadianGermanGerman RussianGhanaianGreekGuamanian/ChamorroGuatemalanGuyaneseHaitianHmongHonduranHopiHoumaHungarianIcelanderIndian (Asian)IndonesianInupiatIranianIraqiIrishIroquoisIsraeliItalianJamaicanJapaneseJordanianKenyanKiowaKoreanLaotianLatvianLebaneseLiberianLithuanianLumbeeLuxembourgerMacedonianMalaysianMalteseMarshalleseMenomineeMexicanMexican American IndianMongolianMoroccanNative HawaiianNavajoNepaleseNew ZealanderNicaraguanNigerianNorthern EuropeanNorwegianOkinawanOsageOttawaPaiutePakistaniPalestinianPanamanianParaguayanPennsylvania GermanPeruvianPimaPolishPortuguesePotawatomiPuebloPuerto RicanPuget Sound SalishRomanianRussianSalvadoranSamoanScandinavianScotch-IrishScottishSenegaleseSerbianShoshoneSierra LeoneanSiouxSlavicSlovakSloveneSomaliSouth AfricanSouth AmericanSouth American IndianSoviet UnionSpaniardSpanishSpanish AmericanSpanish American IndianSri LankanSubsaharan AfricanSudaneseSwedishSwissSyrianTaiwaneseThaiTlingit-HaidaTohono O'OdhamTonganTrinidadian and TobagonianTsimshianTurkishU.S. Virgin IslanderUgandanUkrainianUruguayanUteVenezuelanVietnameseWelshWest IndianYakamaYaquiYugoslavianYumanYup'ikZimbabwean
Immigration
NonimmigrantsImmigrantsAfghanistanAfricaAlbaniaArgentinaArmeniaAsiaAustraliaAustriaBahamasBangladeshBarbadosBelarusBelgiumBelizeBoliviaBosnia and HerzegovinaBrazilBulgariaBurma/MyanmarCabo VerdeCambodiaCameroonCanadaCaribbeanCentral AmericaChileChinaColombiaCongoCosta RicaCroatiaCubaCzechoslovakiaDenmarkDominicaDominican RepublicEastern AfricaEastern AsiaEastern EuropeEcuadorEgyptEl SalvadorEnglandEritreaEthiopiaEuropeFijiFranceGermanyGhanaGreeceGrenadaGuatemalaGuyanaHaitiHondurasHong KongHungaryIndiaIndonesiaIranIraqIrelandIsraelItalyJamaicaJapanJordanKazakhstanKenyaKoreaKuwaitLaosLatin AmericaLatviaLebanonLiberiaLithuaniaMalaysiaMexicoMicronesiaMiddle AfricaMoldovaMoroccoNepalNetherlandsNicaraguaNigeriaNorth AmericaNorth MacedoniaNorthern AfricaNorthern EuropeNorwayOceaniaPakistanPanamaPeruPhilippinesPolandPortugalRomaniaRussiaSaudi ArabiaScotlandSenegalSerbiaSierra LeoneSingaporeSomaliaSouth AfricaSouth AmericaSouth Central AsiaSouth Eastern AsiaSouthern EuropeSpainSri LankaSt. Vincent and the GrenadinesSudanSwedenSwitzerlandSyriaTaiwanThailandTrinidad and TobagoTurkeyUgandaUkraineUruguayUzbekistanVenezuelaVietnamWest IndiesWestern AfricaWestern AsiaWestern EuropeYemenZaireZimbabweAzores
Seminole
Race
Ancestry
AfghanAfricanAlaska NativeAlaskan AthabascanAlbanianAleutAlsatianAmericanApacheArabArapahoArgentineanArmenianAssyrian/Chaldean/SyriacAustralianAustrianBahamianBangladeshiBarbadianBasqueBelgianBelizeanBermudanBhutaneseBlackfeetBolivianBrazilianBritishBritish West IndianBulgarianBurmeseCajunCambodianCanadianCape VerdeanCarpatho RusynCelticCentral AmericanCentral American IndianCherokeeCheyenneChickasawChileanChineseChippewaChoctawColombianColvilleComancheCosta RicanCreeCreekCroatianCrowCubanCypriotCzechCzechoslovakianDanishDelawareDominicanDutchDutch West IndianEastern EuropeanEcuadorianEgyptianEnglishEstonianEthiopianEuropeanFijianFilipinoFinnishFrenchFrench American IndianFrench CanadianGermanGerman RussianGhanaianGreekGuamanian/ChamorroGuatemalanGuyaneseHaitianHonduranHopiHoumaHungarianIcelanderIndian (Asian)IndonesianInupiatIranianIraqiIrishIroquoisIsraeliItalianJamaicanJapaneseJordanianKenyanKiowaKoreanLaotianLatvianLebaneseLiberianLithuanianLumbeeLuxembourgerMacedonianMalaysianMalteseMarshalleseMenomineeMexicanMexican American IndianMongolianMoroccanNative HawaiianNavajoNepaleseNew ZealanderNicaraguanNigerianNorthern EuropeanNorwegianOkinawanOsageOttawaPaiutePakistaniPalestinianPanamanianParaguayanPennsylvania GermanPeruvianPimaPolishPortuguesePotawatomiPuebloPuerto RicanPuget Sound SalishRomanianRussianSalvadoranSamoanScandinavianScotch-IrishScottishSeminoleSenegaleseSerbianShoshoneSierra LeoneanSiouxSlavicSlovakSloveneSomaliSouth AfricanSouth AmericanSouth American IndianSoviet UnionSpaniardSpanishSpanish AmericanSpanish American IndianSri LankanSubsaharan AfricanSudaneseSwedishSwissSyrianTaiwaneseThaiTlingit-HaidaTohono O'OdhamTonganTrinidadian and TobagonianTsimshianTurkishU.S. Virgin IslanderUgandanUkrainianUruguayanUteVenezuelanVietnameseWelshWest IndianYakamaYaquiYugoslavianYumanYup'ikZimbabwean
Immigration
NonimmigrantsImmigrantsAfghanistanAfricaAlbaniaArgentinaArmeniaAsiaAustraliaAustriaBahamasBangladeshBarbadosBelarusBelgiumBelizeBoliviaBosnia and HerzegovinaBrazilBulgariaBurma/MyanmarCabo VerdeCambodiaCameroonCanadaCaribbeanCentral AmericaChileChinaColombiaCongoCosta RicaCroatiaCubaCzechoslovakiaDenmarkDominicaDominican RepublicEastern AfricaEastern AsiaEastern EuropeEcuadorEgyptEl SalvadorEnglandEritreaEthiopiaEuropeFijiFranceGermanyGhanaGreeceGrenadaGuatemalaGuyanaHaitiHondurasHong KongHungaryIndiaIndonesiaIranIraqIrelandIsraelItalyJamaicaJapanJordanKazakhstanKenyaKoreaKuwaitLaosLatin AmericaLatviaLebanonLiberiaLithuaniaMalaysiaMexicoMicronesiaMiddle AfricaMoldovaMoroccoNepalNetherlandsNicaraguaNigeriaNorth AmericaNorth MacedoniaNorthern AfricaNorthern EuropeNorwayOceaniaPakistanPanamaPeruPhilippinesPolandPortugalRomaniaRussiaSaudi ArabiaScotlandSenegalSerbiaSierra LeoneSingaporeSomaliaSouth AfricaSouth AmericaSouth Central AsiaSouth Eastern AsiaSouthern EuropeSpainSri LankaSt. Vincent and the GrenadinesSudanSwedenSwitzerlandSyriaTaiwanThailandTrinidad and TobagoTurkeyUgandaUkraineUruguayUzbekistanVenezuelaVietnamWest IndiesWestern AfricaWestern AsiaWestern EuropeYemenZaireZimbabweAzores
Married-Couple Family Poverty
Income
Poverty
Unemployment
Labor Participation
Family Structure
Vehicle Availability
Education Level
Disability

Married-Couple Family Poverty Comparison

Hmong

Seminole

Excellent
Tragic
5.0%
MARRIED-COUPLE FAMILY POVERTY
83.2/ 100
METRIC RATING
144th/ 347
METRIC RANK
6.4%
MARRIED-COUPLE FAMILY POVERTY
0.0/ 100
METRIC RATING
282nd/ 347
METRIC RANK

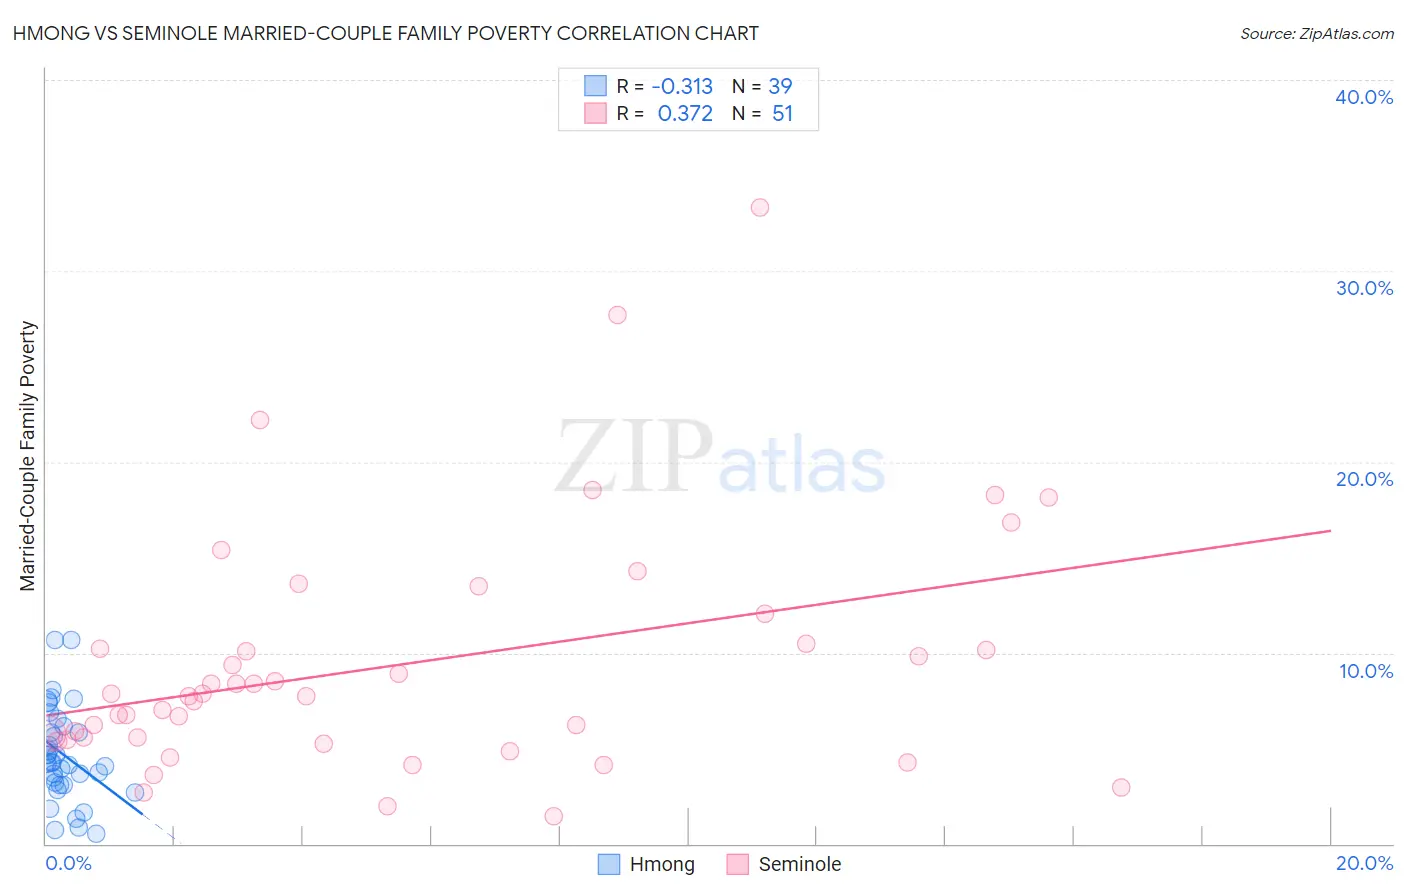
Hmong vs Seminole Married-Couple Family Poverty Correlation Chart

The statistical analysis conducted on geographies consisting of 24,678,157 people shows a mild negative correlation between the proportion of Hmong and poverty level among married-couple families in the United States with a correlation coefficient (R) of -0.313 and weighted average of 5.0%. Similarly, the statistical analysis conducted on geographies consisting of 118,024,519 people shows a mild positive correlation between the proportion of Seminole and poverty level among married-couple families in the United States with a correlation coefficient (R) of 0.372 and weighted average of 6.4%, a difference of 28.9%.
Hmong vs Seminole Married-Couple Family Poverty

Married-Couple Family Poverty Correlation Summary

MeasurementHmongSeminole
Minimum0.50%1.5%
Maximum10.7%33.3%
Range10.2%31.9%
Mean4.7%9.4%
Median4.3%7.7%
Interquartile 25% (IQ1)3.1%5.4%
Interquartile 75% (IQ3)6.1%10.4%
Interquartile Range (IQR)3.0%5.0%
Standard Deviation (Sample)2.4%6.3%
Standard Deviation (Population)2.4%6.3%

Similar Demographics by Married-Couple Family Poverty

Demographics Similar to Hmong by Married-Couple Family Poverty

In terms of married-couple family poverty, the demographic groups most similar to Hmong are Immigrants from Egypt (5.0%, a difference of 0.050%), Immigrants from Brazil (5.0%, a difference of 0.32%), Immigrants from China (5.0%, a difference of 0.32%), Immigrants from Portugal (5.0%, a difference of 0.37%), and German Russian (5.0%, a difference of 0.43%).
DemographicsRating | RankMarried-Couple Family Poverty
Guamanians/Chamorros
86.5
/100
|
#137
Excellent
4.9%
Chileans
86.0
/100
|
#138
Excellent
4.9%
German Russians
85.1
/100
|
#139
Excellent
5.0%
Immigrants | Portugal
84.8
/100
|
#140
Excellent
5.0%
Immigrants | Brazil
84.6
/100
|
#141
Excellent
5.0%
Immigrants | China
84.6
/100
|
#142
Excellent
5.0%
Immigrants | Egypt
83.4
/100
|
#143
Excellent
5.0%
Hmong
83.2
/100
|
#144
Excellent
5.0%
Immigrants | Spain
79.9
/100
|
#145
Good
5.0%
Mongolians
79.8
/100
|
#146
Good
5.0%
Syrians
78.7
/100
|
#147
Good
5.0%
Immigrants | Russia
78.7
/100
|
#148
Good
5.0%
Immigrants | Oceania
78.6
/100
|
#149
Good
5.0%
Brazilians
78.3
/100
|
#150
Good
5.0%
Immigrants | Cameroon
77.3
/100
|
#151
Good
5.0%

Demographics Similar to Seminole by Married-Couple Family Poverty

In terms of married-couple family poverty, the demographic groups most similar to Seminole are Mexican American Indian (6.4%, a difference of 0.0%), Ute (6.4%, a difference of 0.38%), Dutch West Indian (6.4%, a difference of 0.50%), West Indian (6.4%, a difference of 0.51%), and Houma (6.4%, a difference of 0.56%).
DemographicsRating | RankMarried-Couple Family Poverty
Choctaw
0.1
/100
|
#275
Tragic
6.3%
Yaqui
0.1
/100
|
#276
Tragic
6.3%
Indonesians
0.1
/100
|
#277
Tragic
6.3%
Immigrants | Trinidad and Tobago
0.1
/100
|
#278
Tragic
6.4%
Houma
0.0
/100
|
#279
Tragic
6.4%
West Indians
0.0
/100
|
#280
Tragic
6.4%
Mexican American Indians
0.0
/100
|
#281
Tragic
6.4%
Seminole
0.0
/100
|
#282
Tragic
6.4%
Ute
0.0
/100
|
#283
Tragic
6.4%
Dutch West Indians
0.0
/100
|
#284
Tragic
6.4%
Blacks/African Americans
0.0
/100
|
#285
Tragic
6.5%
Guyanese
0.0
/100
|
#286
Tragic
6.5%
Ecuadorians
0.0
/100
|
#287
Tragic
6.5%
Salvadorans
0.0
/100
|
#288
Tragic
6.5%
Nepalese
0.0
/100
|
#289
Tragic
6.5%