Immigrants from Brazil vs Norwegian Married-Couple Family Poverty
COMPARE
Immigrants from Brazil
Norwegian
Married-Couple Family Poverty
Married-Couple Family Poverty Comparison
Immigrants from Brazil
Norwegians
5.0%
MARRIED-COUPLE FAMILY POVERTY
84.6/ 100
METRIC RATING
141st/ 347
METRIC RANK
3.7%
MARRIED-COUPLE FAMILY POVERTY
100.0/ 100
METRIC RATING
3rd/ 347
METRIC RANK
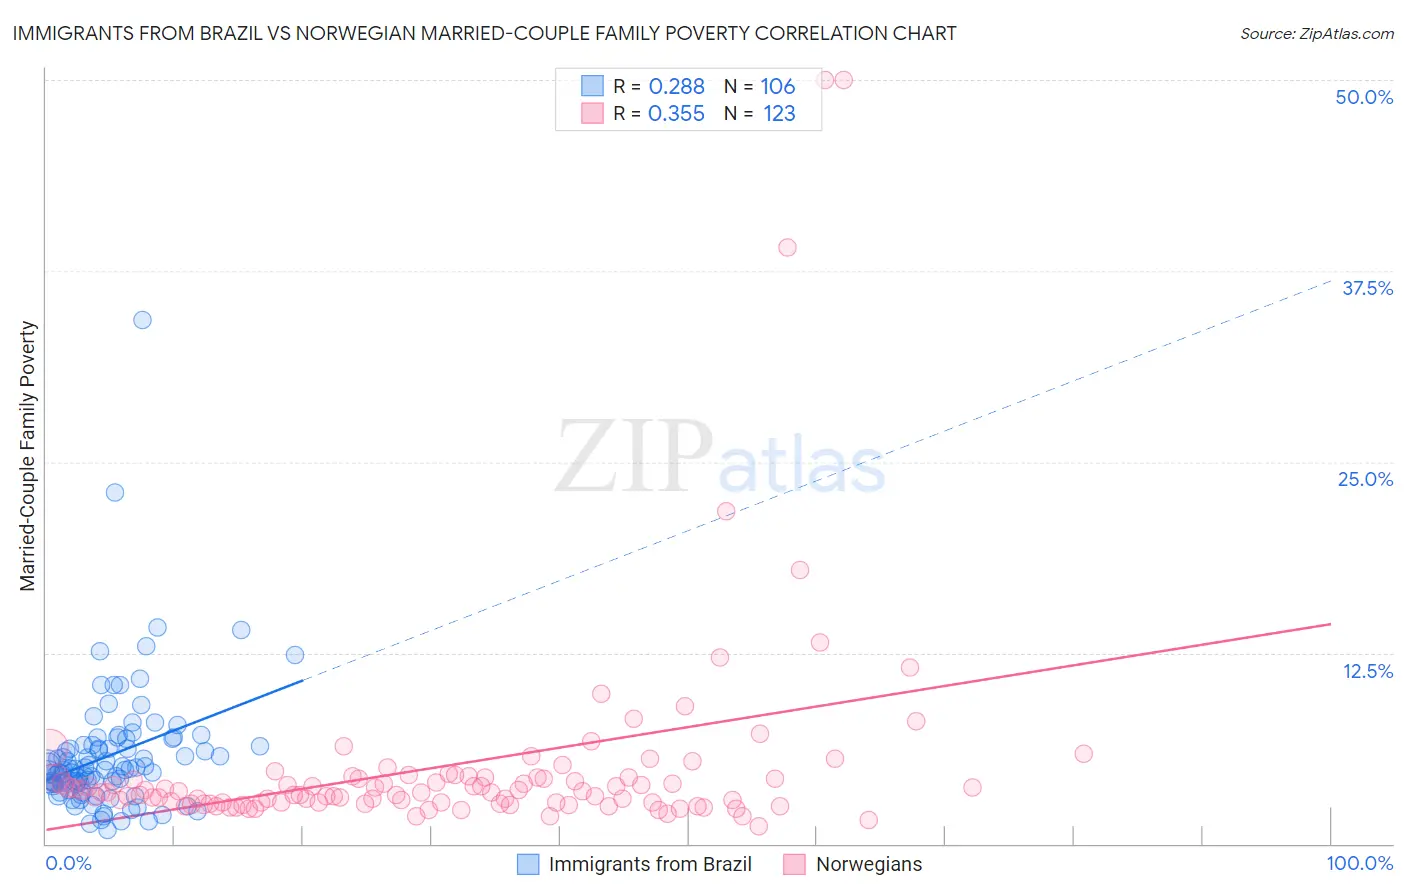
Immigrants from Brazil vs Norwegian Married-Couple Family Poverty Correlation Chart
The statistical analysis conducted on geographies consisting of 340,364,387 people shows a weak positive correlation between the proportion of Immigrants from Brazil and poverty level among married-couple families in the United States with a correlation coefficient (R) of 0.288 and weighted average of 5.0%. Similarly, the statistical analysis conducted on geographies consisting of 522,229,251 people shows a mild positive correlation between the proportion of Norwegians and poverty level among married-couple families in the United States with a correlation coefficient (R) of 0.355 and weighted average of 3.7%, a difference of 33.5%.
Married-Couple Family Poverty Correlation Summary
| Measurement | Immigrants from Brazil | Norwegian |
| Minimum | 0.92% | 1.2% |
| Maximum | 34.3% | 50.0% |
| Range | 33.4% | 48.8% |
| Mean | 5.8% | 5.1% |
| Median | 4.9% | 3.4% |
| Interquartile 25% (IQ1) | 3.9% | 2.7% |
| Interquartile 75% (IQ3) | 6.4% | 4.4% |
| Interquartile Range (IQR) | 2.5% | 1.7% |
| Standard Deviation (Sample) | 4.2% | 7.2% |
| Standard Deviation (Population) | 4.2% | 7.1% |
Similar Demographics by Married-Couple Family Poverty
Demographics Similar to Immigrants from Brazil by Married-Couple Family Poverty
In terms of married-couple family poverty, the demographic groups most similar to Immigrants from Brazil are Immigrants from China (5.0%, a difference of 0.0%), Immigrants from Portugal (5.0%, a difference of 0.050%), German Russian (5.0%, a difference of 0.11%), Immigrants from Egypt (5.0%, a difference of 0.27%), and Hmong (5.0%, a difference of 0.32%).
| Demographics | Rating | Rank | Married-Couple Family Poverty |
| Samoans | 90.2 /100 | #134 | Exceptional 4.9% |
| Assyrians/Chaldeans/Syriacs | 89.4 /100 | #135 | Excellent 4.9% |
| Immigrants | Hungary | 88.7 /100 | #136 | Excellent 4.9% |
| Guamanians/Chamorros | 86.5 /100 | #137 | Excellent 4.9% |
| Chileans | 86.0 /100 | #138 | Excellent 4.9% |
| German Russians | 85.1 /100 | #139 | Excellent 5.0% |
| Immigrants | Portugal | 84.8 /100 | #140 | Excellent 5.0% |
| Immigrants | Brazil | 84.6 /100 | #141 | Excellent 5.0% |
| Immigrants | China | 84.6 /100 | #142 | Excellent 5.0% |
| Immigrants | Egypt | 83.4 /100 | #143 | Excellent 5.0% |
| Hmong | 83.2 /100 | #144 | Excellent 5.0% |
| Immigrants | Spain | 79.9 /100 | #145 | Good 5.0% |
| Mongolians | 79.8 /100 | #146 | Good 5.0% |
| Syrians | 78.7 /100 | #147 | Good 5.0% |
| Immigrants | Russia | 78.7 /100 | #148 | Good 5.0% |
Demographics Similar to Norwegians by Married-Couple Family Poverty
In terms of married-couple family poverty, the demographic groups most similar to Norwegians are Chinese (3.6%, a difference of 1.9%), Immigrants from India (3.6%, a difference of 2.1%), Slovene (3.8%, a difference of 3.6%), Swedish (3.9%, a difference of 3.8%), and Luxembourger (3.9%, a difference of 4.4%).
| Demographics | Rating | Rank | Married-Couple Family Poverty |
| Immigrants | India | 100.0 /100 | #1 | Exceptional 3.6% |
| Chinese | 100.0 /100 | #2 | Exceptional 3.6% |
| Norwegians | 100.0 /100 | #3 | Exceptional 3.7% |
| Slovenes | 100.0 /100 | #4 | Exceptional 3.8% |
| Swedes | 100.0 /100 | #5 | Exceptional 3.9% |
| Luxembourgers | 100.0 /100 | #6 | Exceptional 3.9% |
| Latvians | 100.0 /100 | #7 | Exceptional 3.9% |
| Thais | 100.0 /100 | #8 | Exceptional 3.9% |
| Croatians | 100.0 /100 | #9 | Exceptional 3.9% |
| Carpatho Rusyns | 100.0 /100 | #10 | Exceptional 3.9% |
| Lithuanians | 100.0 /100 | #11 | Exceptional 4.0% |
| Bulgarians | 100.0 /100 | #12 | Exceptional 4.0% |
| Czechs | 100.0 /100 | #13 | Exceptional 4.0% |
| Slovaks | 100.0 /100 | #14 | Exceptional 4.0% |
| Poles | 100.0 /100 | #15 | Exceptional 4.0% |