Immigrants from Guatemala vs Immigrants from Bosnia and Herzegovina Married-Couple Family Poverty
COMPARE
Immigrants from Guatemala
Immigrants from Bosnia and Herzegovina
Married-Couple Family Poverty
Married-Couple Family Poverty Comparison
Immigrants from Guatemala
Immigrants from Bosnia and Herzegovina
7.2%
MARRIED-COUPLE FAMILY POVERTY
0.0/ 100
METRIC RATING
318th/ 347
METRIC RANK
4.8%
MARRIED-COUPLE FAMILY POVERTY
92.5/ 100
METRIC RATING
125th/ 347
METRIC RANK
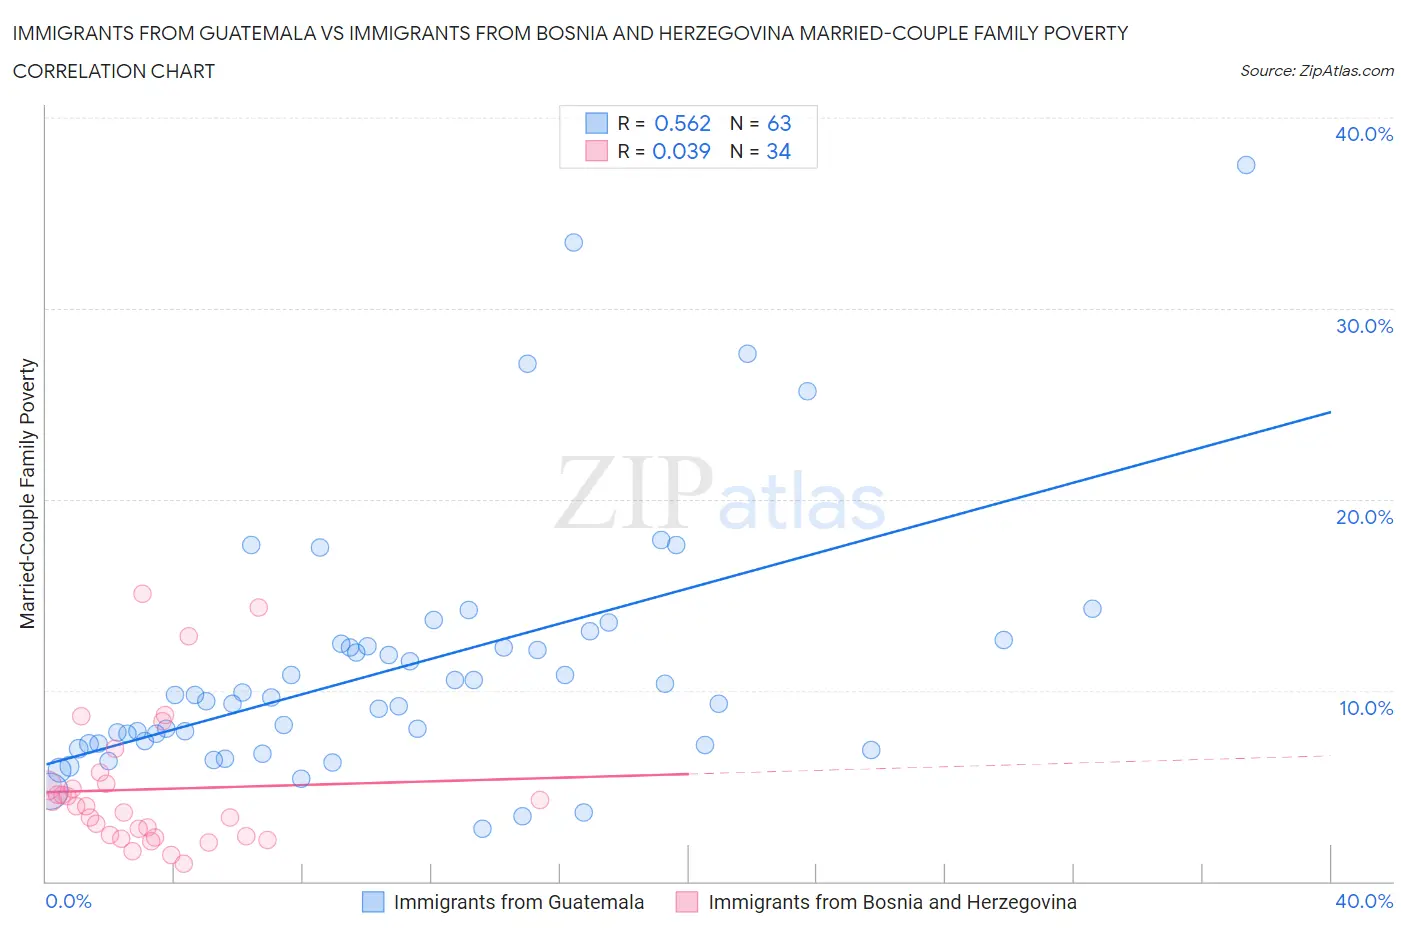
Immigrants from Guatemala vs Immigrants from Bosnia and Herzegovina Married-Couple Family Poverty Correlation Chart
The statistical analysis conducted on geographies consisting of 375,097,244 people shows a substantial positive correlation between the proportion of Immigrants from Guatemala and poverty level among married-couple families in the United States with a correlation coefficient (R) of 0.562 and weighted average of 7.2%. Similarly, the statistical analysis conducted on geographies consisting of 156,293,901 people shows no correlation between the proportion of Immigrants from Bosnia and Herzegovina and poverty level among married-couple families in the United States with a correlation coefficient (R) of 0.039 and weighted average of 4.8%, a difference of 48.6%.
Married-Couple Family Poverty Correlation Summary
| Measurement | Immigrants from Guatemala | Immigrants from Bosnia and Herzegovina |
| Minimum | 2.7% | 0.92% |
| Maximum | 37.5% | 15.1% |
| Range | 34.8% | 14.1% |
| Mean | 11.2% | 4.8% |
| Median | 9.6% | 3.9% |
| Interquartile 25% (IQ1) | 7.2% | 2.3% |
| Interquartile 75% (IQ3) | 12.5% | 5.1% |
| Interquartile Range (IQR) | 5.3% | 2.7% |
| Standard Deviation (Sample) | 6.7% | 3.5% |
| Standard Deviation (Population) | 6.6% | 3.5% |
Similar Demographics by Married-Couple Family Poverty
Demographics Similar to Immigrants from Guatemala by Married-Couple Family Poverty
In terms of married-couple family poverty, the demographic groups most similar to Immigrants from Guatemala are Mexican (7.2%, a difference of 0.17%), Immigrants from Latin America (7.2%, a difference of 0.17%), Honduran (7.2%, a difference of 0.48%), Inupiat (7.1%, a difference of 0.63%), and British West Indian (7.1%, a difference of 0.87%).
| Demographics | Rating | Rank | Married-Couple Family Poverty |
| Immigrants | Dominica | 0.0 /100 | #311 | Tragic 7.1% |
| Immigrants | Armenia | 0.0 /100 | #312 | Tragic 7.1% |
| Immigrants | St. Vincent and the Grenadines | 0.0 /100 | #313 | Tragic 7.1% |
| British West Indians | 0.0 /100 | #314 | Tragic 7.1% |
| Inupiat | 0.0 /100 | #315 | Tragic 7.1% |
| Hondurans | 0.0 /100 | #316 | Tragic 7.2% |
| Mexicans | 0.0 /100 | #317 | Tragic 7.2% |
| Immigrants | Guatemala | 0.0 /100 | #318 | Tragic 7.2% |
| Immigrants | Latin America | 0.0 /100 | #319 | Tragic 7.2% |
| Immigrants | Grenada | 0.0 /100 | #320 | Tragic 7.3% |
| Immigrants | Caribbean | 0.0 /100 | #321 | Tragic 7.3% |
| Immigrants | Honduras | 0.0 /100 | #322 | Tragic 7.3% |
| Vietnamese | 0.0 /100 | #323 | Tragic 7.4% |
| Immigrants | Central America | 0.0 /100 | #324 | Tragic 7.4% |
| Immigrants | Cuba | 0.0 /100 | #325 | Tragic 7.5% |
Demographics Similar to Immigrants from Bosnia and Herzegovina by Married-Couple Family Poverty
In terms of married-couple family poverty, the demographic groups most similar to Immigrants from Bosnia and Herzegovina are Romanian (4.8%, a difference of 0.020%), Immigrants from Asia (4.8%, a difference of 0.070%), Egyptian (4.8%, a difference of 0.21%), Jordanian (4.8%, a difference of 0.29%), and White/Caucasian (4.8%, a difference of 0.30%).
| Demographics | Rating | Rank | Married-Couple Family Poverty |
| Immigrants | Philippines | 94.6 /100 | #118 | Exceptional 4.8% |
| Immigrants | Eastern Asia | 94.0 /100 | #119 | Exceptional 4.8% |
| Immigrants | Southern Europe | 93.4 /100 | #120 | Exceptional 4.8% |
| Indians (Asian) | 93.2 /100 | #121 | Exceptional 4.8% |
| Whites/Caucasians | 93.1 /100 | #122 | Exceptional 4.8% |
| Jordanians | 93.1 /100 | #123 | Exceptional 4.8% |
| Romanians | 92.5 /100 | #124 | Exceptional 4.8% |
| Immigrants | Bosnia and Herzegovina | 92.5 /100 | #125 | Exceptional 4.8% |
| Immigrants | Asia | 92.3 /100 | #126 | Exceptional 4.8% |
| Egyptians | 92.0 /100 | #127 | Exceptional 4.8% |
| Palestinians | 91.2 /100 | #128 | Exceptional 4.9% |
| Immigrants | Pakistan | 90.7 /100 | #129 | Exceptional 4.9% |
| Soviet Union | 90.7 /100 | #130 | Exceptional 4.9% |
| Immigrants | Eastern Europe | 90.5 /100 | #131 | Exceptional 4.9% |
| Puget Sound Salish | 90.4 /100 | #132 | Exceptional 4.9% |