Portuguese vs Immigrants from Bosnia and Herzegovina Married-Couple Family Poverty
COMPARE
Portuguese
Immigrants from Bosnia and Herzegovina
Married-Couple Family Poverty
Married-Couple Family Poverty Comparison
Portuguese
Immigrants from Bosnia and Herzegovina
4.6%
MARRIED-COUPLE FAMILY POVERTY
98.3/ 100
METRIC RATING
95th/ 347
METRIC RANK
4.8%
MARRIED-COUPLE FAMILY POVERTY
92.5/ 100
METRIC RATING
125th/ 347
METRIC RANK
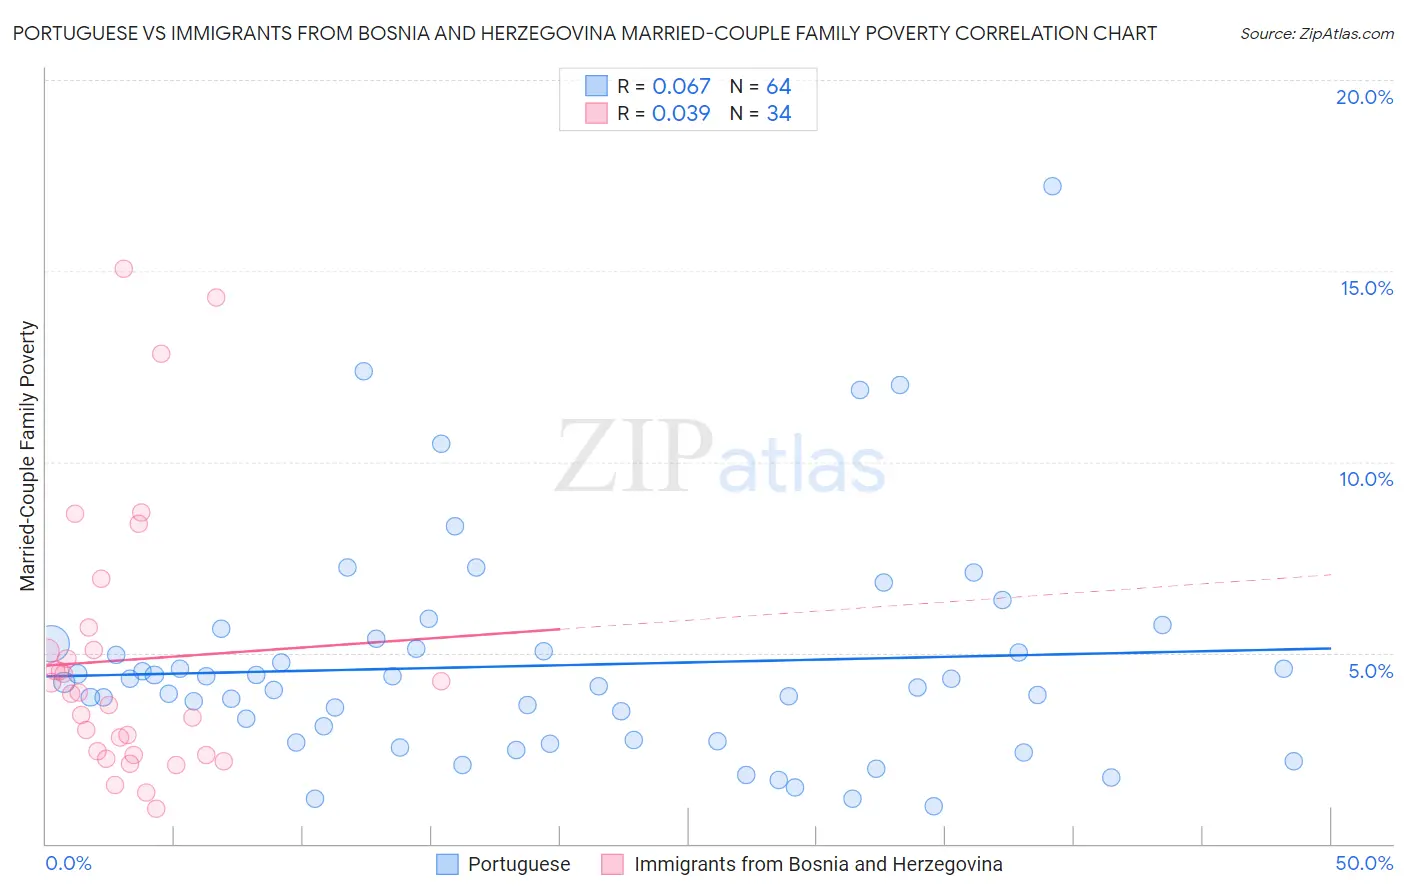
Portuguese vs Immigrants from Bosnia and Herzegovina Married-Couple Family Poverty Correlation Chart
The statistical analysis conducted on geographies consisting of 444,135,508 people shows a slight positive correlation between the proportion of Portuguese and poverty level among married-couple families in the United States with a correlation coefficient (R) of 0.067 and weighted average of 4.6%. Similarly, the statistical analysis conducted on geographies consisting of 156,293,901 people shows no correlation between the proportion of Immigrants from Bosnia and Herzegovina and poverty level among married-couple families in the United States with a correlation coefficient (R) of 0.039 and weighted average of 4.8%, a difference of 5.1%.
Married-Couple Family Poverty Correlation Summary
| Measurement | Portuguese | Immigrants from Bosnia and Herzegovina |
| Minimum | 0.98% | 0.92% |
| Maximum | 17.2% | 15.1% |
| Range | 16.2% | 14.1% |
| Mean | 4.7% | 4.8% |
| Median | 4.2% | 3.9% |
| Interquartile 25% (IQ1) | 2.7% | 2.3% |
| Interquartile 75% (IQ3) | 5.2% | 5.1% |
| Interquartile Range (IQR) | 2.5% | 2.7% |
| Standard Deviation (Sample) | 2.9% | 3.5% |
| Standard Deviation (Population) | 2.9% | 3.5% |
Similar Demographics by Married-Couple Family Poverty
Demographics Similar to Portuguese by Married-Couple Family Poverty
In terms of married-couple family poverty, the demographic groups most similar to Portuguese are Immigrants from Italy (4.6%, a difference of 0.040%), Immigrants from Poland (4.6%, a difference of 0.080%), Korean (4.6%, a difference of 0.090%), Immigrants from Belgium (4.6%, a difference of 0.13%), and Immigrants from Norway (4.6%, a difference of 0.27%).
| Demographics | Rating | Rank | Married-Couple Family Poverty |
| Bolivians | 98.6 /100 | #88 | Exceptional 4.6% |
| Immigrants | Czechoslovakia | 98.5 /100 | #89 | Exceptional 4.6% |
| Immigrants | Switzerland | 98.5 /100 | #90 | Exceptional 4.6% |
| Basques | 98.5 /100 | #91 | Exceptional 4.6% |
| Immigrants | Norway | 98.4 /100 | #92 | Exceptional 4.6% |
| Koreans | 98.3 /100 | #93 | Exceptional 4.6% |
| Immigrants | Italy | 98.3 /100 | #94 | Exceptional 4.6% |
| Portuguese | 98.3 /100 | #95 | Exceptional 4.6% |
| Immigrants | Poland | 98.3 /100 | #96 | Exceptional 4.6% |
| Immigrants | Belgium | 98.2 /100 | #97 | Exceptional 4.6% |
| Native Hawaiians | 98.0 /100 | #98 | Exceptional 4.6% |
| Immigrants | Europe | 97.9 /100 | #99 | Exceptional 4.6% |
| Immigrants | Western Europe | 97.9 /100 | #100 | Exceptional 4.6% |
| Yugoslavians | 97.8 /100 | #101 | Exceptional 4.6% |
| Asians | 97.6 /100 | #102 | Exceptional 4.7% |
Demographics Similar to Immigrants from Bosnia and Herzegovina by Married-Couple Family Poverty
In terms of married-couple family poverty, the demographic groups most similar to Immigrants from Bosnia and Herzegovina are Romanian (4.8%, a difference of 0.020%), Immigrants from Asia (4.8%, a difference of 0.070%), Egyptian (4.8%, a difference of 0.21%), Jordanian (4.8%, a difference of 0.29%), and White/Caucasian (4.8%, a difference of 0.30%).
| Demographics | Rating | Rank | Married-Couple Family Poverty |
| Immigrants | Philippines | 94.6 /100 | #118 | Exceptional 4.8% |
| Immigrants | Eastern Asia | 94.0 /100 | #119 | Exceptional 4.8% |
| Immigrants | Southern Europe | 93.4 /100 | #120 | Exceptional 4.8% |
| Indians (Asian) | 93.2 /100 | #121 | Exceptional 4.8% |
| Whites/Caucasians | 93.1 /100 | #122 | Exceptional 4.8% |
| Jordanians | 93.1 /100 | #123 | Exceptional 4.8% |
| Romanians | 92.5 /100 | #124 | Exceptional 4.8% |
| Immigrants | Bosnia and Herzegovina | 92.5 /100 | #125 | Exceptional 4.8% |
| Immigrants | Asia | 92.3 /100 | #126 | Exceptional 4.8% |
| Egyptians | 92.0 /100 | #127 | Exceptional 4.8% |
| Palestinians | 91.2 /100 | #128 | Exceptional 4.9% |
| Immigrants | Pakistan | 90.7 /100 | #129 | Exceptional 4.9% |
| Soviet Union | 90.7 /100 | #130 | Exceptional 4.9% |
| Immigrants | Eastern Europe | 90.5 /100 | #131 | Exceptional 4.9% |
| Puget Sound Salish | 90.4 /100 | #132 | Exceptional 4.9% |