Cuban vs Immigrants from Sudan Seniors Poverty Over the Age of 65
COMPARE
Cuban
Immigrants from Sudan
Seniors Poverty Over the Age of 65
Seniors Poverty Over the Age of 65 Comparison
Cubans
Immigrants from Sudan
16.1%
SENIORS POVERTY OVER THE AGE OF 65
0.0/ 100
METRIC RATING
335th/ 347
METRIC RANK
10.9%
SENIORS POVERTY OVER THE AGE OF 65
50.0/ 100
METRIC RATING
174th/ 347
METRIC RANK
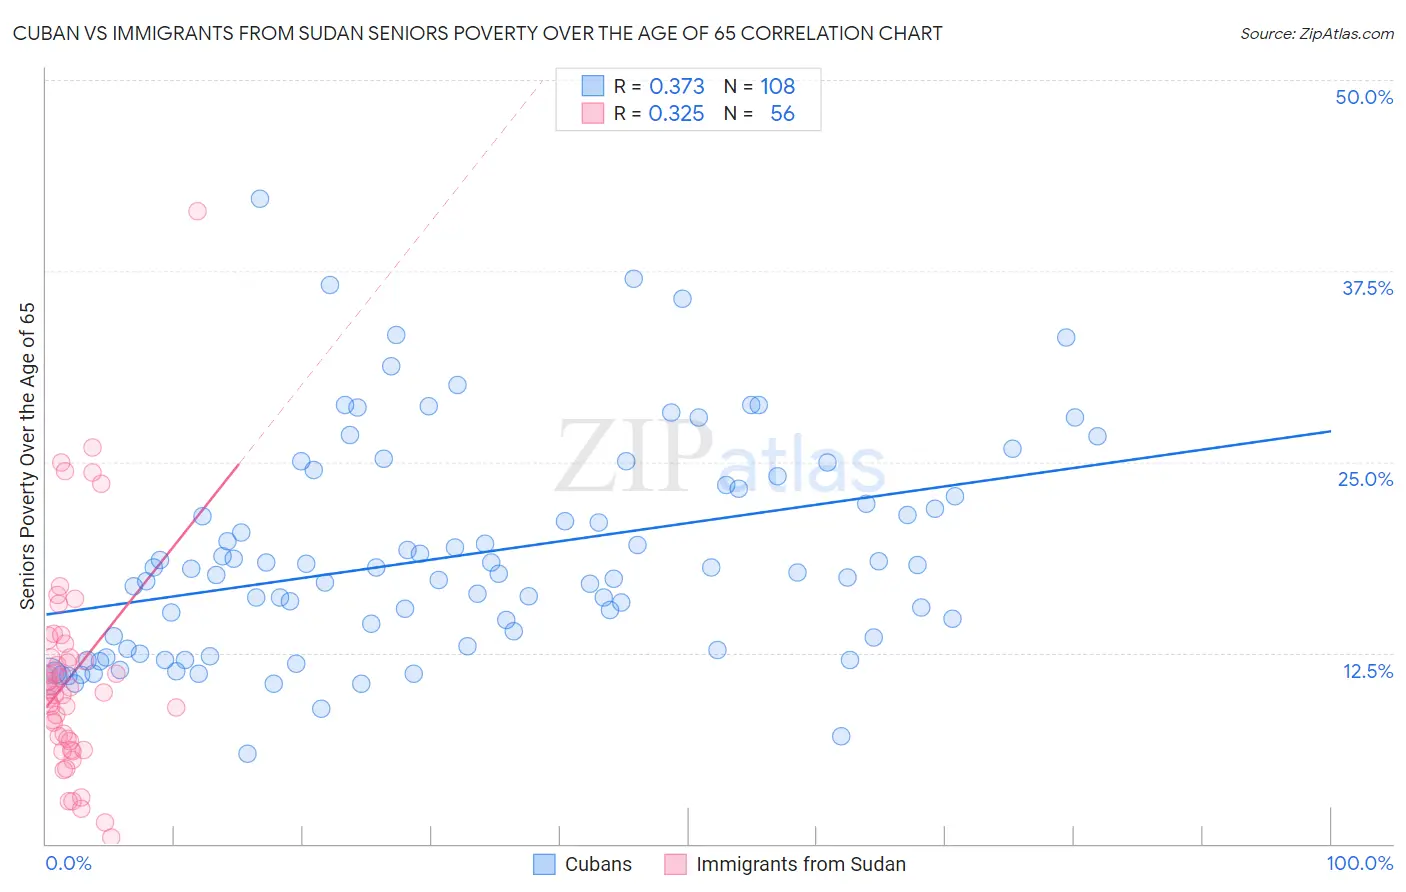
Cuban vs Immigrants from Sudan Seniors Poverty Over the Age of 65 Correlation Chart
The statistical analysis conducted on geographies consisting of 447,431,553 people shows a mild positive correlation between the proportion of Cubans and poverty level among seniors over the age of 65 in the United States with a correlation coefficient (R) of 0.373 and weighted average of 16.1%. Similarly, the statistical analysis conducted on geographies consisting of 118,879,063 people shows a mild positive correlation between the proportion of Immigrants from Sudan and poverty level among seniors over the age of 65 in the United States with a correlation coefficient (R) of 0.325 and weighted average of 10.9%, a difference of 47.3%.
Seniors Poverty Over the Age of 65 Correlation Summary
| Measurement | Cuban | Immigrants from Sudan |
| Minimum | 5.9% | 0.39% |
| Maximum | 42.2% | 41.4% |
| Range | 36.3% | 41.0% |
| Mean | 18.8% | 11.1% |
| Median | 17.7% | 10.0% |
| Interquartile 25% (IQ1) | 12.9% | 6.8% |
| Interquartile 75% (IQ3) | 23.0% | 12.7% |
| Interquartile Range (IQR) | 10.1% | 5.8% |
| Standard Deviation (Sample) | 7.1% | 7.1% |
| Standard Deviation (Population) | 7.1% | 7.1% |
Similar Demographics by Seniors Poverty Over the Age of 65
Demographics Similar to Cubans by Seniors Poverty Over the Age of 65
In terms of seniors poverty over the age of 65, the demographic groups most similar to Cubans are Immigrants from Cabo Verde (16.2%, a difference of 0.57%), Immigrants from Nicaragua (15.9%, a difference of 1.3%), Immigrants from Yemen (15.9%, a difference of 1.4%), Immigrants from Grenada (15.8%, a difference of 1.9%), and Immigrants from Caribbean (16.5%, a difference of 2.4%).
| Demographics | Rating | Rank | Seniors Poverty Over the Age of 65 |
| Sioux | 0.0 /100 | #328 | Tragic 15.3% |
| Immigrants | Dominica | 0.0 /100 | #329 | Tragic 15.5% |
| Immigrants | St. Vincent and the Grenadines | 0.0 /100 | #330 | Tragic 15.5% |
| British West Indians | 0.0 /100 | #331 | Tragic 15.6% |
| Immigrants | Grenada | 0.0 /100 | #332 | Tragic 15.8% |
| Immigrants | Yemen | 0.0 /100 | #333 | Tragic 15.9% |
| Immigrants | Nicaragua | 0.0 /100 | #334 | Tragic 15.9% |
| Cubans | 0.0 /100 | #335 | Tragic 16.1% |
| Immigrants | Cabo Verde | 0.0 /100 | #336 | Tragic 16.2% |
| Immigrants | Caribbean | 0.0 /100 | #337 | Tragic 16.5% |
| Pueblo | 0.0 /100 | #338 | Tragic 17.2% |
| Navajo | 0.0 /100 | #339 | Tragic 17.5% |
| Hopi | 0.0 /100 | #340 | Tragic 17.8% |
| Dominicans | 0.0 /100 | #341 | Tragic 17.8% |
| Immigrants | Cuba | 0.0 /100 | #342 | Tragic 17.9% |
Demographics Similar to Immigrants from Sudan by Seniors Poverty Over the Age of 65
In terms of seniors poverty over the age of 65, the demographic groups most similar to Immigrants from Sudan are Creek (10.9%, a difference of 0.040%), Spaniard (10.9%, a difference of 0.070%), Immigrants from Malaysia (11.0%, a difference of 0.19%), Cherokee (11.0%, a difference of 0.24%), and German Russian (11.0%, a difference of 0.28%).
| Demographics | Rating | Rank | Seniors Poverty Over the Age of 65 |
| Alaska Natives | 60.3 /100 | #167 | Good 10.8% |
| Mongolians | 58.0 /100 | #168 | Average 10.9% |
| Sri Lankans | 56.8 /100 | #169 | Average 10.9% |
| Immigrants | Eastern Europe | 55.8 /100 | #170 | Average 10.9% |
| Immigrants | Nonimmigrants | 55.1 /100 | #171 | Average 10.9% |
| Immigrants | Syria | 54.7 /100 | #172 | Average 10.9% |
| Spaniards | 50.7 /100 | #173 | Average 10.9% |
| Immigrants | Sudan | 50.0 /100 | #174 | Average 10.9% |
| Creek | 49.6 /100 | #175 | Average 10.9% |
| Immigrants | Malaysia | 47.9 /100 | #176 | Average 11.0% |
| Cherokee | 47.3 /100 | #177 | Average 11.0% |
| German Russians | 46.9 /100 | #178 | Average 11.0% |
| Immigrants | Northern Africa | 44.6 /100 | #179 | Average 11.0% |
| Immigrants | Thailand | 43.5 /100 | #180 | Average 11.0% |
| Immigrants | Eastern Africa | 43.4 /100 | #181 | Average 11.0% |