Cuban vs Immigrants from Sudan Unemployment Among Ages 20 to 24 years
COMPARE
Cuban
Immigrants from Sudan
Unemployment Among Ages 20 to 24 years
Unemployment Among Ages 20 to 24 years Comparison
Cubans
Immigrants from Sudan
9.2%
UNEMPLOYMENT AMONG AGES 20 TO 24 YEARS
100.0/ 100
METRIC RATING
12th/ 347
METRIC RANK
9.3%
UNEMPLOYMENT AMONG AGES 20 TO 24 YEARS
100.0/ 100
METRIC RATING
15th/ 347
METRIC RANK
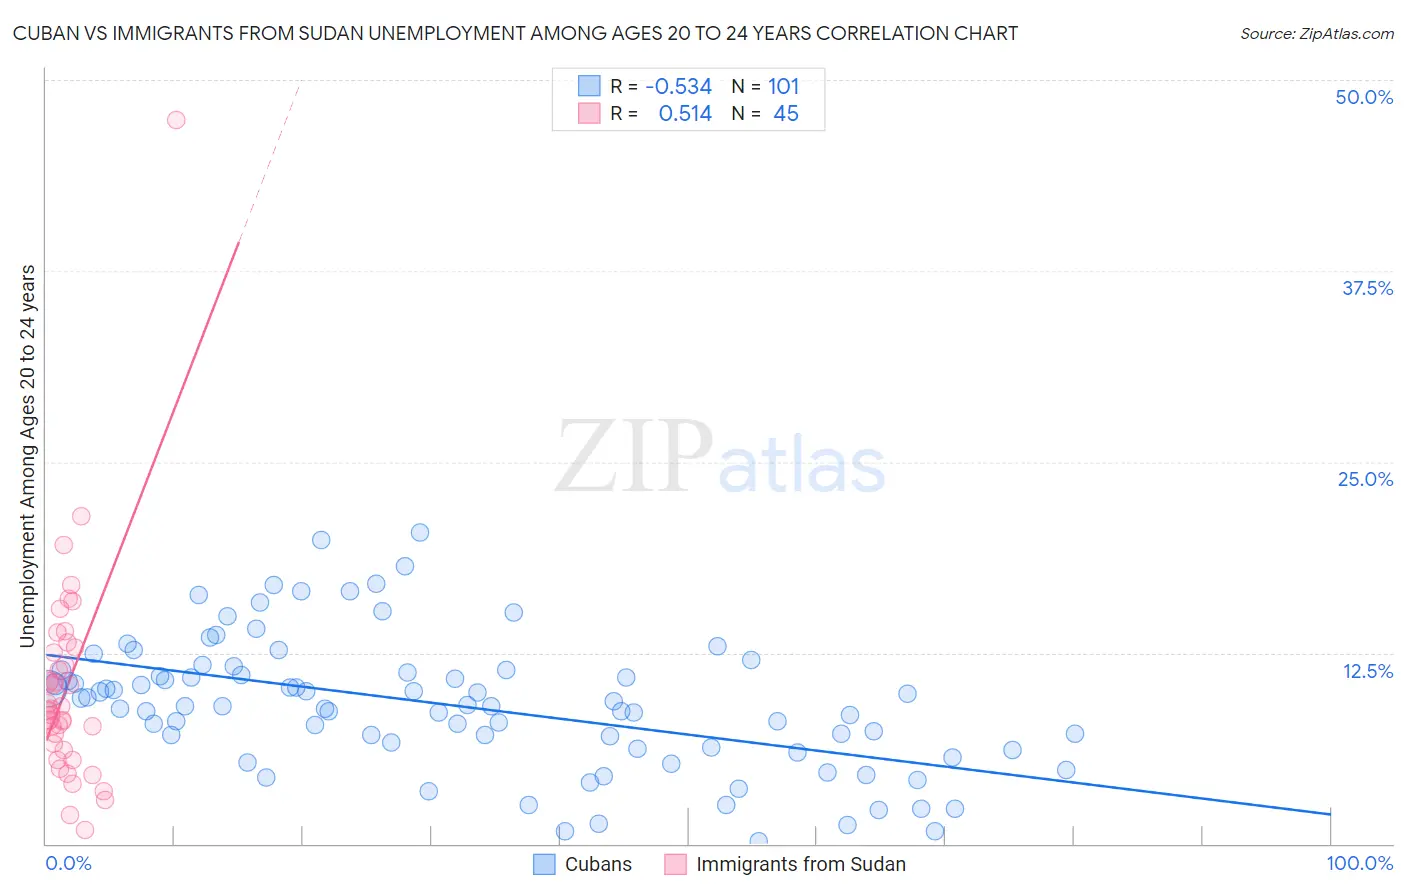
Cuban vs Immigrants from Sudan Unemployment Among Ages 20 to 24 years Correlation Chart
The statistical analysis conducted on geographies consisting of 433,228,061 people shows a substantial negative correlation between the proportion of Cubans and unemployment rate among population between the ages 20 and 24 in the United States with a correlation coefficient (R) of -0.534 and weighted average of 9.2%. Similarly, the statistical analysis conducted on geographies consisting of 118,369,819 people shows a substantial positive correlation between the proportion of Immigrants from Sudan and unemployment rate among population between the ages 20 and 24 in the United States with a correlation coefficient (R) of 0.514 and weighted average of 9.3%, a difference of 0.49%.
Unemployment Among Ages 20 to 24 years Correlation Summary
| Measurement | Cuban | Immigrants from Sudan |
| Minimum | 0.20% | 0.90% |
| Maximum | 20.4% | 47.4% |
| Range | 20.2% | 46.5% |
| Mean | 9.1% | 10.2% |
| Median | 9.0% | 8.8% |
| Interquartile 25% (IQ1) | 6.2% | 6.4% |
| Interquartile 75% (IQ3) | 11.3% | 12.7% |
| Interquartile Range (IQR) | 5.0% | 6.3% |
| Standard Deviation (Sample) | 4.3% | 7.2% |
| Standard Deviation (Population) | 4.3% | 7.2% |
Demographics Similar to Cubans and Immigrants from Sudan by Unemployment Among Ages 20 to 24 years
In terms of unemployment among ages 20 to 24 years, the demographic groups most similar to Cubans are Immigrants from Congo (9.2%, a difference of 0.080%), Zimbabwean (9.2%, a difference of 0.10%), Slovene (9.3%, a difference of 0.47%), Sudanese (9.2%, a difference of 0.55%), and Danish (9.3%, a difference of 0.65%). Similarly, the demographic groups most similar to Immigrants from Sudan are Slovene (9.3%, a difference of 0.030%), Danish (9.3%, a difference of 0.16%), Immigrants from Congo (9.2%, a difference of 0.41%), Zimbabwean (9.2%, a difference of 0.60%), and Czech (9.3%, a difference of 0.67%).
| Demographics | Rating | Rank | Unemployment Among Ages 20 to 24 years |
| Indonesians | 100.0 /100 | #3 | Exceptional 9.0% |
| Venezuelans | 100.0 /100 | #4 | Exceptional 9.0% |
| Norwegians | 100.0 /100 | #5 | Exceptional 9.0% |
| Immigrants | Burma/Myanmar | 100.0 /100 | #6 | Exceptional 9.1% |
| Luxembourgers | 100.0 /100 | #7 | Exceptional 9.1% |
| Somalis | 100.0 /100 | #8 | Exceptional 9.1% |
| Immigrants | Somalia | 100.0 /100 | #9 | Exceptional 9.2% |
| Sudanese | 100.0 /100 | #10 | Exceptional 9.2% |
| Zimbabweans | 100.0 /100 | #11 | Exceptional 9.2% |
| Cubans | 100.0 /100 | #12 | Exceptional 9.2% |
| Immigrants | Congo | 100.0 /100 | #13 | Exceptional 9.2% |
| Slovenes | 100.0 /100 | #14 | Exceptional 9.3% |
| Immigrants | Sudan | 100.0 /100 | #15 | Exceptional 9.3% |
| Danes | 100.0 /100 | #16 | Exceptional 9.3% |
| Czechs | 100.0 /100 | #17 | Exceptional 9.3% |
| Chinese | 100.0 /100 | #18 | Exceptional 9.4% |
| Hmong | 100.0 /100 | #19 | Exceptional 9.4% |
| Osage | 100.0 /100 | #20 | Exceptional 9.4% |
| Immigrants | Bosnia and Herzegovina | 100.0 /100 | #21 | Exceptional 9.4% |
| Tongans | 100.0 /100 | #22 | Exceptional 9.4% |
| Immigrants | Nepal | 100.0 /100 | #23 | Exceptional 9.4% |