Comanche vs Greek Married-Couple Family Poverty
COMPARE
Comanche
Greek
Married-Couple Family Poverty
Married-Couple Family Poverty Comparison
Comanche
Greeks
6.0%
MARRIED-COUPLE FAMILY POVERTY
0.7/ 100
METRIC RATING
255th/ 347
METRIC RANK
4.2%
MARRIED-COUPLE FAMILY POVERTY
99.9/ 100
METRIC RATING
32nd/ 347
METRIC RANK
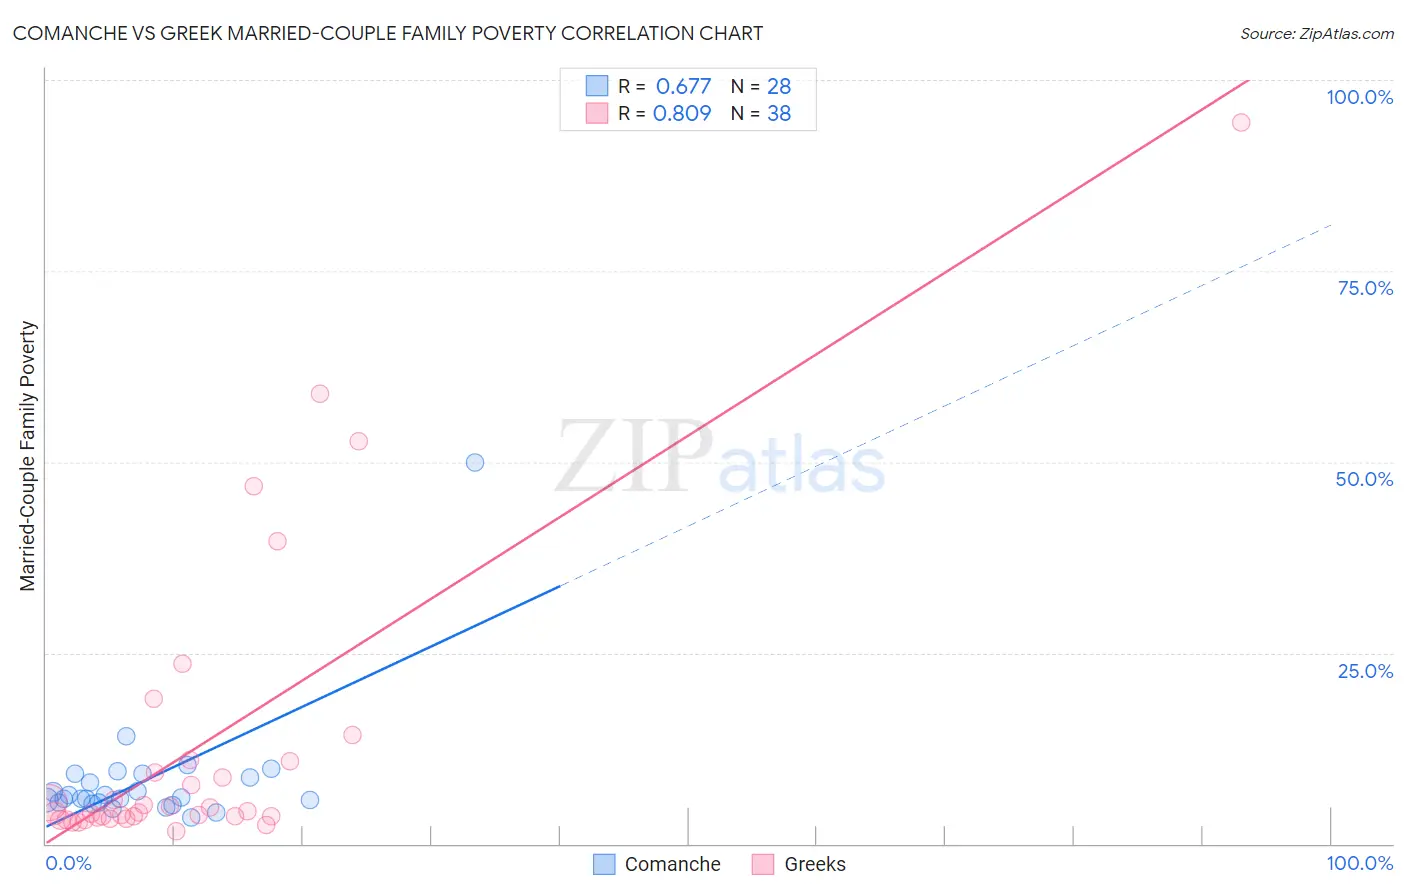
Comanche vs Greek Married-Couple Family Poverty Correlation Chart
The statistical analysis conducted on geographies consisting of 109,532,955 people shows a significant positive correlation between the proportion of Comanche and poverty level among married-couple families in the United States with a correlation coefficient (R) of 0.677 and weighted average of 6.0%. Similarly, the statistical analysis conducted on geographies consisting of 475,318,702 people shows a very strong positive correlation between the proportion of Greeks and poverty level among married-couple families in the United States with a correlation coefficient (R) of 0.809 and weighted average of 4.2%, a difference of 43.4%.
Married-Couple Family Poverty Correlation Summary
| Measurement | Comanche | Greek |
| Minimum | 3.4% | 1.6% |
| Maximum | 50.0% | 94.4% |
| Range | 46.6% | 92.7% |
| Mean | 8.4% | 12.9% |
| Median | 6.0% | 4.2% |
| Interquartile 25% (IQ1) | 5.4% | 3.5% |
| Interquartile 75% (IQ3) | 8.9% | 10.8% |
| Interquartile Range (IQR) | 3.5% | 7.3% |
| Standard Deviation (Sample) | 8.5% | 19.8% |
| Standard Deviation (Population) | 8.3% | 19.6% |
Similar Demographics by Married-Couple Family Poverty
Demographics Similar to Comanche by Married-Couple Family Poverty
In terms of married-couple family poverty, the demographic groups most similar to Comanche are Immigrants from Somalia (6.0%, a difference of 0.15%), African (6.0%, a difference of 0.21%), Immigrants from Western Asia (6.0%, a difference of 0.30%), Bangladeshi (6.0%, a difference of 0.50%), and Immigrants from Burma/Myanmar (6.0%, a difference of 0.74%).
| Demographics | Rating | Rank | Married-Couple Family Poverty |
| Cree | 1.2 /100 | #248 | Tragic 5.9% |
| Tsimshian | 1.1 /100 | #249 | Tragic 5.9% |
| Immigrants | Eritrea | 1.1 /100 | #250 | Tragic 5.9% |
| Immigrants | Ghana | 1.0 /100 | #251 | Tragic 5.9% |
| Immigrants | Western Asia | 0.7 /100 | #252 | Tragic 6.0% |
| Africans | 0.7 /100 | #253 | Tragic 6.0% |
| Immigrants | Somalia | 0.7 /100 | #254 | Tragic 6.0% |
| Comanche | 0.7 /100 | #255 | Tragic 6.0% |
| Bangladeshis | 0.5 /100 | #256 | Tragic 6.0% |
| Immigrants | Burma/Myanmar | 0.5 /100 | #257 | Tragic 6.0% |
| Immigrants | Immigrants | 0.5 /100 | #258 | Tragic 6.0% |
| Alaskan Athabascans | 0.4 /100 | #259 | Tragic 6.1% |
| Jamaicans | 0.3 /100 | #260 | Tragic 6.1% |
| Senegalese | 0.3 /100 | #261 | Tragic 6.1% |
| Shoshone | 0.3 /100 | #262 | Tragic 6.1% |
Demographics Similar to Greeks by Married-Couple Family Poverty
In terms of married-couple family poverty, the demographic groups most similar to Greeks are Estonian (4.2%, a difference of 0.11%), Finnish (4.2%, a difference of 0.19%), Immigrants from Scotland (4.2%, a difference of 0.43%), Scandinavian (4.1%, a difference of 0.47%), and Irish (4.2%, a difference of 0.48%).
| Demographics | Rating | Rank | Married-Couple Family Poverty |
| Immigrants | Taiwan | 99.9 /100 | #25 | Exceptional 4.1% |
| Cypriots | 99.9 /100 | #26 | Exceptional 4.1% |
| Danes | 99.9 /100 | #27 | Exceptional 4.1% |
| Scandinavians | 99.9 /100 | #28 | Exceptional 4.1% |
| Immigrants | Scotland | 99.9 /100 | #29 | Exceptional 4.2% |
| Finns | 99.9 /100 | #30 | Exceptional 4.2% |
| Estonians | 99.9 /100 | #31 | Exceptional 4.2% |
| Greeks | 99.9 /100 | #32 | Exceptional 4.2% |
| Irish | 99.9 /100 | #33 | Exceptional 4.2% |
| Dutch | 99.9 /100 | #34 | Exceptional 4.2% |
| Europeans | 99.9 /100 | #35 | Exceptional 4.2% |
| English | 99.9 /100 | #36 | Exceptional 4.2% |
| Iranians | 99.9 /100 | #37 | Exceptional 4.2% |
| Belgians | 99.9 /100 | #38 | Exceptional 4.2% |
| Immigrants | Northern Europe | 99.8 /100 | #39 | Exceptional 4.2% |