Comanche vs Immigrants from Mexico Married-Couple Family Poverty
COMPARE
Comanche
Immigrants from Mexico
Married-Couple Family Poverty
Married-Couple Family Poverty Comparison
Comanche
Immigrants from Mexico
6.0%
MARRIED-COUPLE FAMILY POVERTY
0.7/ 100
METRIC RATING
255th/ 347
METRIC RANK
7.6%
MARRIED-COUPLE FAMILY POVERTY
0.0/ 100
METRIC RATING
328th/ 347
METRIC RANK
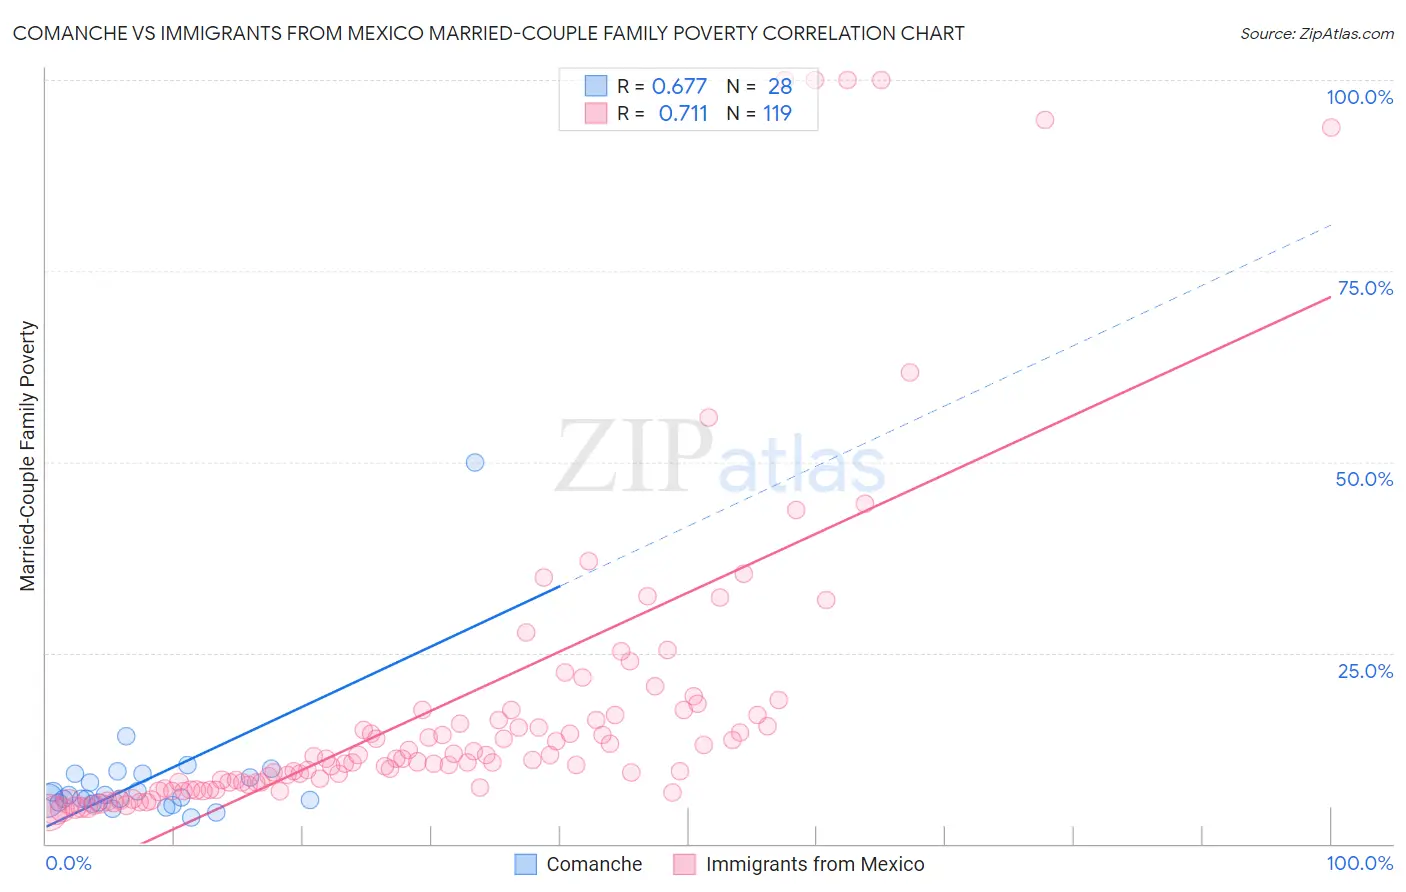
Comanche vs Immigrants from Mexico Married-Couple Family Poverty Correlation Chart
The statistical analysis conducted on geographies consisting of 109,532,955 people shows a significant positive correlation between the proportion of Comanche and poverty level among married-couple families in the United States with a correlation coefficient (R) of 0.677 and weighted average of 6.0%. Similarly, the statistical analysis conducted on geographies consisting of 506,470,232 people shows a strong positive correlation between the proportion of Immigrants from Mexico and poverty level among married-couple families in the United States with a correlation coefficient (R) of 0.711 and weighted average of 7.6%, a difference of 26.8%.
Married-Couple Family Poverty Correlation Summary
| Measurement | Comanche | Immigrants from Mexico |
| Minimum | 3.4% | 4.1% |
| Maximum | 50.0% | 100.0% |
| Range | 46.6% | 95.9% |
| Mean | 8.4% | 18.1% |
| Median | 6.0% | 11.1% |
| Interquartile 25% (IQ1) | 5.4% | 7.8% |
| Interquartile 75% (IQ3) | 8.9% | 16.8% |
| Interquartile Range (IQR) | 3.5% | 9.1% |
| Standard Deviation (Sample) | 8.5% | 21.0% |
| Standard Deviation (Population) | 8.3% | 21.0% |
Similar Demographics by Married-Couple Family Poverty
Demographics Similar to Comanche by Married-Couple Family Poverty
In terms of married-couple family poverty, the demographic groups most similar to Comanche are Immigrants from Somalia (6.0%, a difference of 0.15%), African (6.0%, a difference of 0.21%), Immigrants from Western Asia (6.0%, a difference of 0.30%), Bangladeshi (6.0%, a difference of 0.50%), and Immigrants from Burma/Myanmar (6.0%, a difference of 0.74%).
| Demographics | Rating | Rank | Married-Couple Family Poverty |
| Cree | 1.2 /100 | #248 | Tragic 5.9% |
| Tsimshian | 1.1 /100 | #249 | Tragic 5.9% |
| Immigrants | Eritrea | 1.1 /100 | #250 | Tragic 5.9% |
| Immigrants | Ghana | 1.0 /100 | #251 | Tragic 5.9% |
| Immigrants | Western Asia | 0.7 /100 | #252 | Tragic 6.0% |
| Africans | 0.7 /100 | #253 | Tragic 6.0% |
| Immigrants | Somalia | 0.7 /100 | #254 | Tragic 6.0% |
| Comanche | 0.7 /100 | #255 | Tragic 6.0% |
| Bangladeshis | 0.5 /100 | #256 | Tragic 6.0% |
| Immigrants | Burma/Myanmar | 0.5 /100 | #257 | Tragic 6.0% |
| Immigrants | Immigrants | 0.5 /100 | #258 | Tragic 6.0% |
| Alaskan Athabascans | 0.4 /100 | #259 | Tragic 6.1% |
| Jamaicans | 0.3 /100 | #260 | Tragic 6.1% |
| Senegalese | 0.3 /100 | #261 | Tragic 6.1% |
| Shoshone | 0.3 /100 | #262 | Tragic 6.1% |
Demographics Similar to Immigrants from Mexico by Married-Couple Family Poverty
In terms of married-couple family poverty, the demographic groups most similar to Immigrants from Mexico are Immigrants from Bangladesh (7.5%, a difference of 1.2%), Hispanic or Latino (7.5%, a difference of 1.2%), Immigrants from Cuba (7.5%, a difference of 1.4%), Immigrants from Central America (7.4%, a difference of 2.0%), and Vietnamese (7.4%, a difference of 2.1%).
| Demographics | Rating | Rank | Married-Couple Family Poverty |
| Immigrants | Caribbean | 0.0 /100 | #321 | Tragic 7.3% |
| Immigrants | Honduras | 0.0 /100 | #322 | Tragic 7.3% |
| Vietnamese | 0.0 /100 | #323 | Tragic 7.4% |
| Immigrants | Central America | 0.0 /100 | #324 | Tragic 7.4% |
| Immigrants | Cuba | 0.0 /100 | #325 | Tragic 7.5% |
| Immigrants | Bangladesh | 0.0 /100 | #326 | Tragic 7.5% |
| Hispanics or Latinos | 0.0 /100 | #327 | Tragic 7.5% |
| Immigrants | Mexico | 0.0 /100 | #328 | Tragic 7.6% |
| Natives/Alaskans | 0.0 /100 | #329 | Tragic 8.2% |
| Paiute | 0.0 /100 | #330 | Tragic 8.3% |
| Central American Indians | 0.0 /100 | #331 | Tragic 8.3% |
| Dominicans | 0.0 /100 | #332 | Tragic 8.3% |
| Lumbee | 0.0 /100 | #333 | Tragic 8.3% |
| Immigrants | Dominican Republic | 0.0 /100 | #334 | Tragic 8.4% |
| Sioux | 0.0 /100 | #335 | Tragic 8.7% |