Comanche vs Alaska Native Married-Couple Family Poverty
COMPARE
Comanche
Alaska Native
Married-Couple Family Poverty
Married-Couple Family Poverty Comparison
Comanche
Alaska Natives
6.0%
MARRIED-COUPLE FAMILY POVERTY
0.7/ 100
METRIC RATING
255th/ 347
METRIC RANK
6.2%
MARRIED-COUPLE FAMILY POVERTY
0.2/ 100
METRIC RATING
268th/ 347
METRIC RANK
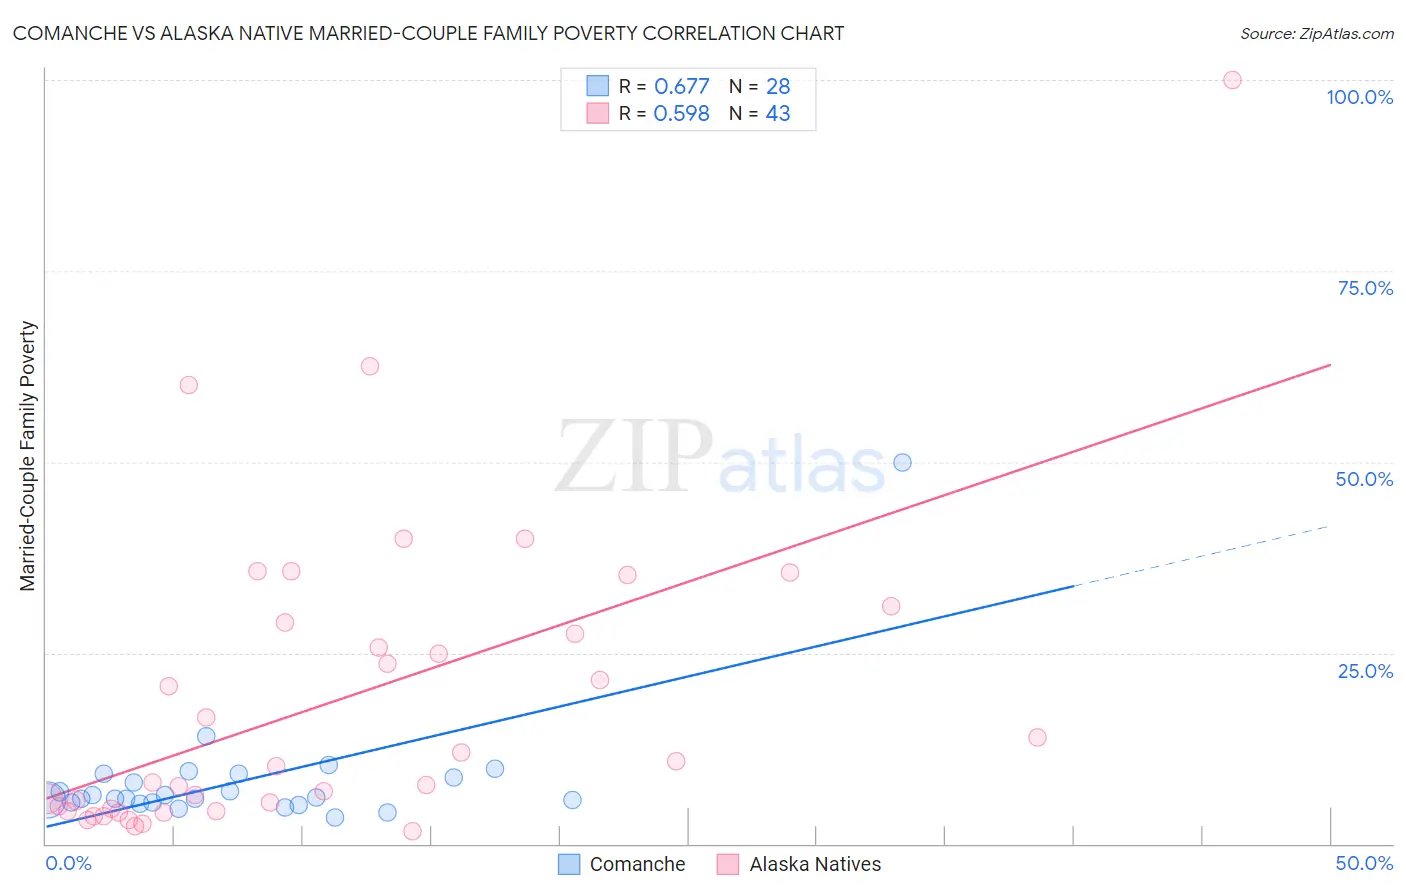
Comanche vs Alaska Native Married-Couple Family Poverty Correlation Chart
The statistical analysis conducted on geographies consisting of 109,532,955 people shows a significant positive correlation between the proportion of Comanche and poverty level among married-couple families in the United States with a correlation coefficient (R) of 0.677 and weighted average of 6.0%. Similarly, the statistical analysis conducted on geographies consisting of 76,597,225 people shows a substantial positive correlation between the proportion of Alaska Natives and poverty level among married-couple families in the United States with a correlation coefficient (R) of 0.598 and weighted average of 6.2%, a difference of 3.8%.
Married-Couple Family Poverty Correlation Summary
| Measurement | Comanche | Alaska Native |
| Minimum | 3.4% | 1.6% |
| Maximum | 50.0% | 100.0% |
| Range | 46.6% | 98.4% |
| Mean | 8.4% | 18.9% |
| Median | 6.0% | 10.2% |
| Interquartile 25% (IQ1) | 5.4% | 4.3% |
| Interquartile 75% (IQ3) | 8.9% | 28.9% |
| Interquartile Range (IQR) | 3.5% | 24.6% |
| Standard Deviation (Sample) | 8.5% | 20.2% |
| Standard Deviation (Population) | 8.3% | 19.9% |
Demographics Similar to Comanche and Alaska Natives by Married-Couple Family Poverty
In terms of married-couple family poverty, the demographic groups most similar to Comanche are Immigrants from Somalia (6.0%, a difference of 0.15%), African (6.0%, a difference of 0.21%), Immigrants from Western Asia (6.0%, a difference of 0.30%), Bangladeshi (6.0%, a difference of 0.50%), and Immigrants from Burma/Myanmar (6.0%, a difference of 0.74%). Similarly, the demographic groups most similar to Alaska Natives are Immigrants from West Indies (6.2%, a difference of 0.17%), Immigrants from Jamaica (6.2%, a difference of 0.21%), Immigrants from Bahamas (6.2%, a difference of 0.43%), Spanish American (6.2%, a difference of 0.48%), and Creek (6.2%, a difference of 0.53%).
| Demographics | Rating | Rank | Married-Couple Family Poverty |
| Immigrants | Ghana | 1.0 /100 | #251 | Tragic 5.9% |
| Immigrants | Western Asia | 0.7 /100 | #252 | Tragic 6.0% |
| Africans | 0.7 /100 | #253 | Tragic 6.0% |
| Immigrants | Somalia | 0.7 /100 | #254 | Tragic 6.0% |
| Comanche | 0.7 /100 | #255 | Tragic 6.0% |
| Bangladeshis | 0.5 /100 | #256 | Tragic 6.0% |
| Immigrants | Burma/Myanmar | 0.5 /100 | #257 | Tragic 6.0% |
| Immigrants | Immigrants | 0.5 /100 | #258 | Tragic 6.0% |
| Alaskan Athabascans | 0.4 /100 | #259 | Tragic 6.1% |
| Jamaicans | 0.3 /100 | #260 | Tragic 6.1% |
| Senegalese | 0.3 /100 | #261 | Tragic 6.1% |
| Shoshone | 0.3 /100 | #262 | Tragic 6.1% |
| Immigrants | Senegal | 0.3 /100 | #263 | Tragic 6.1% |
| Immigrants | Congo | 0.2 /100 | #264 | Tragic 6.1% |
| Blackfeet | 0.2 /100 | #265 | Tragic 6.2% |
| Creek | 0.2 /100 | #266 | Tragic 6.2% |
| Spanish Americans | 0.2 /100 | #267 | Tragic 6.2% |
| Alaska Natives | 0.2 /100 | #268 | Tragic 6.2% |
| Immigrants | West Indies | 0.1 /100 | #269 | Tragic 6.2% |
| Immigrants | Jamaica | 0.1 /100 | #270 | Tragic 6.2% |
| Immigrants | Bahamas | 0.1 /100 | #271 | Tragic 6.2% |