Immigrants from Canada vs Greek Married-Couple Family Poverty
COMPARE
Immigrants from Canada
Greek
Married-Couple Family Poverty
Married-Couple Family Poverty Comparison
Immigrants from Canada
Greeks
4.4%
MARRIED-COUPLE FAMILY POVERTY
99.4/ 100
METRIC RATING
67th/ 347
METRIC RANK
4.2%
MARRIED-COUPLE FAMILY POVERTY
99.9/ 100
METRIC RATING
32nd/ 347
METRIC RANK
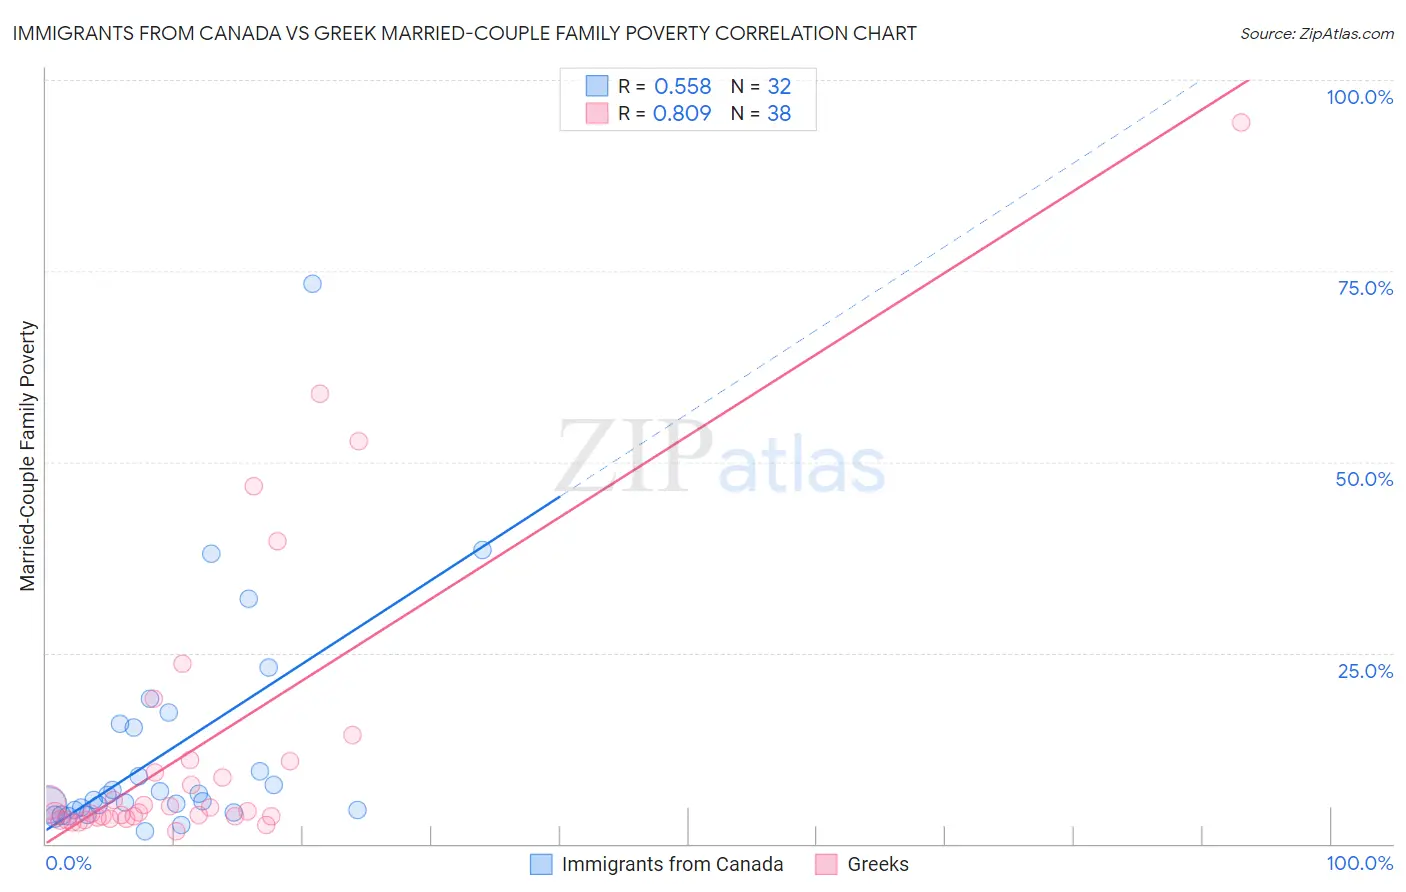
Immigrants from Canada vs Greek Married-Couple Family Poverty Correlation Chart
The statistical analysis conducted on geographies consisting of 453,127,885 people shows a substantial positive correlation between the proportion of Immigrants from Canada and poverty level among married-couple families in the United States with a correlation coefficient (R) of 0.558 and weighted average of 4.4%. Similarly, the statistical analysis conducted on geographies consisting of 475,318,702 people shows a very strong positive correlation between the proportion of Greeks and poverty level among married-couple families in the United States with a correlation coefficient (R) of 0.809 and weighted average of 4.2%, a difference of 6.6%.
Married-Couple Family Poverty Correlation Summary
| Measurement | Immigrants from Canada | Greek |
| Minimum | 1.7% | 1.6% |
| Maximum | 73.3% | 94.4% |
| Range | 71.6% | 92.7% |
| Mean | 12.3% | 12.9% |
| Median | 6.1% | 4.2% |
| Interquartile 25% (IQ1) | 4.4% | 3.5% |
| Interquartile 75% (IQ3) | 15.5% | 10.8% |
| Interquartile Range (IQR) | 11.0% | 7.3% |
| Standard Deviation (Sample) | 14.9% | 19.8% |
| Standard Deviation (Population) | 14.7% | 19.6% |
Similar Demographics by Married-Couple Family Poverty
Demographics Similar to Immigrants from Canada by Married-Couple Family Poverty
In terms of married-couple family poverty, the demographic groups most similar to Immigrants from Canada are Slavic (4.4%, a difference of 0.010%), New Zealander (4.4%, a difference of 0.030%), Immigrants from Serbia (4.4%, a difference of 0.050%), Immigrants from Korea (4.5%, a difference of 0.16%), and Macedonian (4.4%, a difference of 0.18%).
| Demographics | Rating | Rank | Married-Couple Family Poverty |
| Tlingit-Haida | 99.6 /100 | #60 | Exceptional 4.4% |
| Okinawans | 99.6 /100 | #61 | Exceptional 4.4% |
| Immigrants | Australia | 99.6 /100 | #62 | Exceptional 4.4% |
| Immigrants | Sri Lanka | 99.6 /100 | #63 | Exceptional 4.4% |
| Immigrants | Bulgaria | 99.5 /100 | #64 | Exceptional 4.4% |
| Macedonians | 99.4 /100 | #65 | Exceptional 4.4% |
| Immigrants | Serbia | 99.4 /100 | #66 | Exceptional 4.4% |
| Immigrants | Canada | 99.4 /100 | #67 | Exceptional 4.4% |
| Slavs | 99.4 /100 | #68 | Exceptional 4.4% |
| New Zealanders | 99.4 /100 | #69 | Exceptional 4.4% |
| Immigrants | Korea | 99.4 /100 | #70 | Exceptional 4.5% |
| Immigrants | North America | 99.3 /100 | #71 | Exceptional 4.5% |
| Immigrants | England | 99.3 /100 | #72 | Exceptional 4.5% |
| Ukrainians | 99.2 /100 | #73 | Exceptional 4.5% |
| Immigrants | Austria | 99.2 /100 | #74 | Exceptional 4.5% |
Demographics Similar to Greeks by Married-Couple Family Poverty
In terms of married-couple family poverty, the demographic groups most similar to Greeks are Estonian (4.2%, a difference of 0.11%), Finnish (4.2%, a difference of 0.19%), Immigrants from Scotland (4.2%, a difference of 0.43%), Scandinavian (4.1%, a difference of 0.47%), and Irish (4.2%, a difference of 0.48%).
| Demographics | Rating | Rank | Married-Couple Family Poverty |
| Immigrants | Taiwan | 99.9 /100 | #25 | Exceptional 4.1% |
| Cypriots | 99.9 /100 | #26 | Exceptional 4.1% |
| Danes | 99.9 /100 | #27 | Exceptional 4.1% |
| Scandinavians | 99.9 /100 | #28 | Exceptional 4.1% |
| Immigrants | Scotland | 99.9 /100 | #29 | Exceptional 4.2% |
| Finns | 99.9 /100 | #30 | Exceptional 4.2% |
| Estonians | 99.9 /100 | #31 | Exceptional 4.2% |
| Greeks | 99.9 /100 | #32 | Exceptional 4.2% |
| Irish | 99.9 /100 | #33 | Exceptional 4.2% |
| Dutch | 99.9 /100 | #34 | Exceptional 4.2% |
| Europeans | 99.9 /100 | #35 | Exceptional 4.2% |
| English | 99.9 /100 | #36 | Exceptional 4.2% |
| Iranians | 99.9 /100 | #37 | Exceptional 4.2% |
| Belgians | 99.9 /100 | #38 | Exceptional 4.2% |
| Immigrants | Northern Europe | 99.8 /100 | #39 | Exceptional 4.2% |