Comanche vs Immigrants from Panama Married-Couple Family Poverty
COMPARE
Comanche
Immigrants from Panama
Married-Couple Family Poverty
Married-Couple Family Poverty Comparison
Comanche
Immigrants from Panama
6.0%
MARRIED-COUPLE FAMILY POVERTY
0.7/ 100
METRIC RATING
255th/ 347
METRIC RANK
5.8%
MARRIED-COUPLE FAMILY POVERTY
2.5/ 100
METRIC RATING
241st/ 347
METRIC RANK
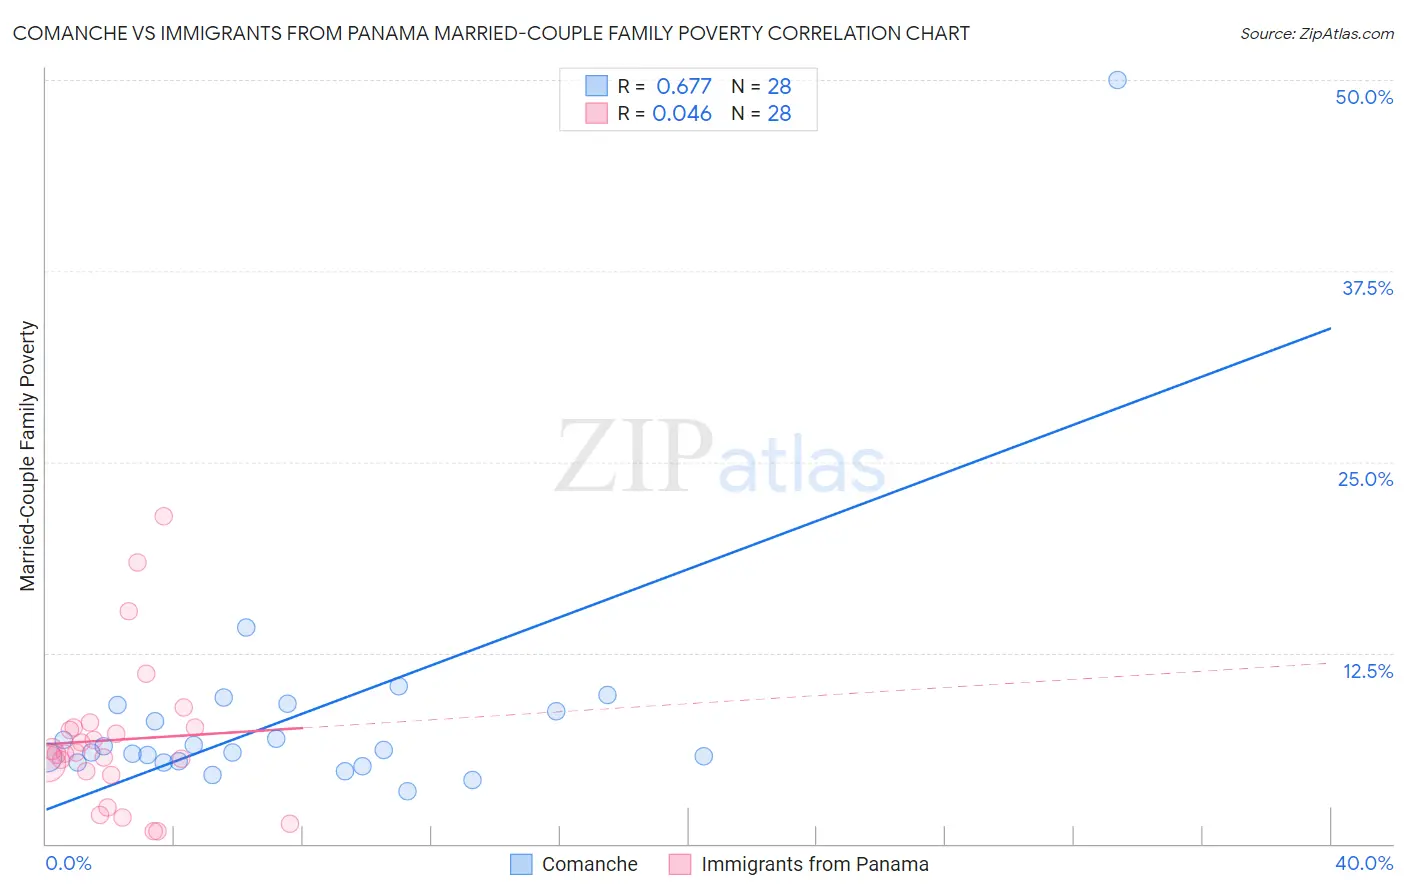
Comanche vs Immigrants from Panama Married-Couple Family Poverty Correlation Chart
The statistical analysis conducted on geographies consisting of 109,532,955 people shows a significant positive correlation between the proportion of Comanche and poverty level among married-couple families in the United States with a correlation coefficient (R) of 0.677 and weighted average of 6.0%. Similarly, the statistical analysis conducted on geographies consisting of 220,360,551 people shows no correlation between the proportion of Immigrants from Panama and poverty level among married-couple families in the United States with a correlation coefficient (R) of 0.046 and weighted average of 5.8%, a difference of 3.5%.
Married-Couple Family Poverty Correlation Summary
| Measurement | Comanche | Immigrants from Panama |
| Minimum | 3.4% | 0.83% |
| Maximum | 50.0% | 21.5% |
| Range | 46.6% | 20.6% |
| Mean | 8.4% | 6.8% |
| Median | 6.0% | 5.9% |
| Interquartile 25% (IQ1) | 5.4% | 4.6% |
| Interquartile 75% (IQ3) | 8.9% | 7.6% |
| Interquartile Range (IQR) | 3.5% | 2.9% |
| Standard Deviation (Sample) | 8.5% | 4.9% |
| Standard Deviation (Population) | 8.3% | 4.8% |
Demographics Similar to Comanche and Immigrants from Panama by Married-Couple Family Poverty
In terms of married-couple family poverty, the demographic groups most similar to Comanche are Immigrants from Somalia (6.0%, a difference of 0.15%), African (6.0%, a difference of 0.21%), Immigrants from Western Asia (6.0%, a difference of 0.30%), Bangladeshi (6.0%, a difference of 0.50%), and Immigrants from Burma/Myanmar (6.0%, a difference of 0.74%). Similarly, the demographic groups most similar to Immigrants from Panama are Fijian (5.8%, a difference of 0.020%), Immigrants from Western Africa (5.8%, a difference of 0.090%), Venezuelan (5.8%, a difference of 0.19%), Cherokee (5.8%, a difference of 0.22%), and Somali (5.8%, a difference of 0.24%).
| Demographics | Rating | Rank | Married-Couple Family Poverty |
| Cherokee | 2.7 /100 | #238 | Tragic 5.8% |
| Venezuelans | 2.7 /100 | #239 | Tragic 5.8% |
| Fijians | 2.5 /100 | #240 | Tragic 5.8% |
| Immigrants | Panama | 2.5 /100 | #241 | Tragic 5.8% |
| Immigrants | Western Africa | 2.4 /100 | #242 | Tragic 5.8% |
| Somalis | 2.3 /100 | #243 | Tragic 5.8% |
| Chickasaw | 2.3 /100 | #244 | Tragic 5.8% |
| Immigrants | Afghanistan | 2.1 /100 | #245 | Tragic 5.8% |
| Immigrants | Venezuela | 1.8 /100 | #246 | Tragic 5.8% |
| Iraqis | 1.4 /100 | #247 | Tragic 5.9% |
| Cree | 1.2 /100 | #248 | Tragic 5.9% |
| Tsimshian | 1.1 /100 | #249 | Tragic 5.9% |
| Immigrants | Eritrea | 1.1 /100 | #250 | Tragic 5.9% |
| Immigrants | Ghana | 1.0 /100 | #251 | Tragic 5.9% |
| Immigrants | Western Asia | 0.7 /100 | #252 | Tragic 6.0% |
| Africans | 0.7 /100 | #253 | Tragic 6.0% |
| Immigrants | Somalia | 0.7 /100 | #254 | Tragic 6.0% |
| Comanche | 0.7 /100 | #255 | Tragic 6.0% |
| Bangladeshis | 0.5 /100 | #256 | Tragic 6.0% |
| Immigrants | Burma/Myanmar | 0.5 /100 | #257 | Tragic 6.0% |
| Immigrants | Immigrants | 0.5 /100 | #258 | Tragic 6.0% |