Chickasaw vs Yugoslavian Male Poverty
COMPARE
Chickasaw
Yugoslavian
Male Poverty
Male Poverty Comparison
Chickasaw
Yugoslavians
13.5%
MALE POVERTY
0.0/ 100
METRIC RATING
273rd/ 347
METRIC RANK
10.8%
MALE POVERTY
78.2/ 100
METRIC RATING
138th/ 347
METRIC RANK
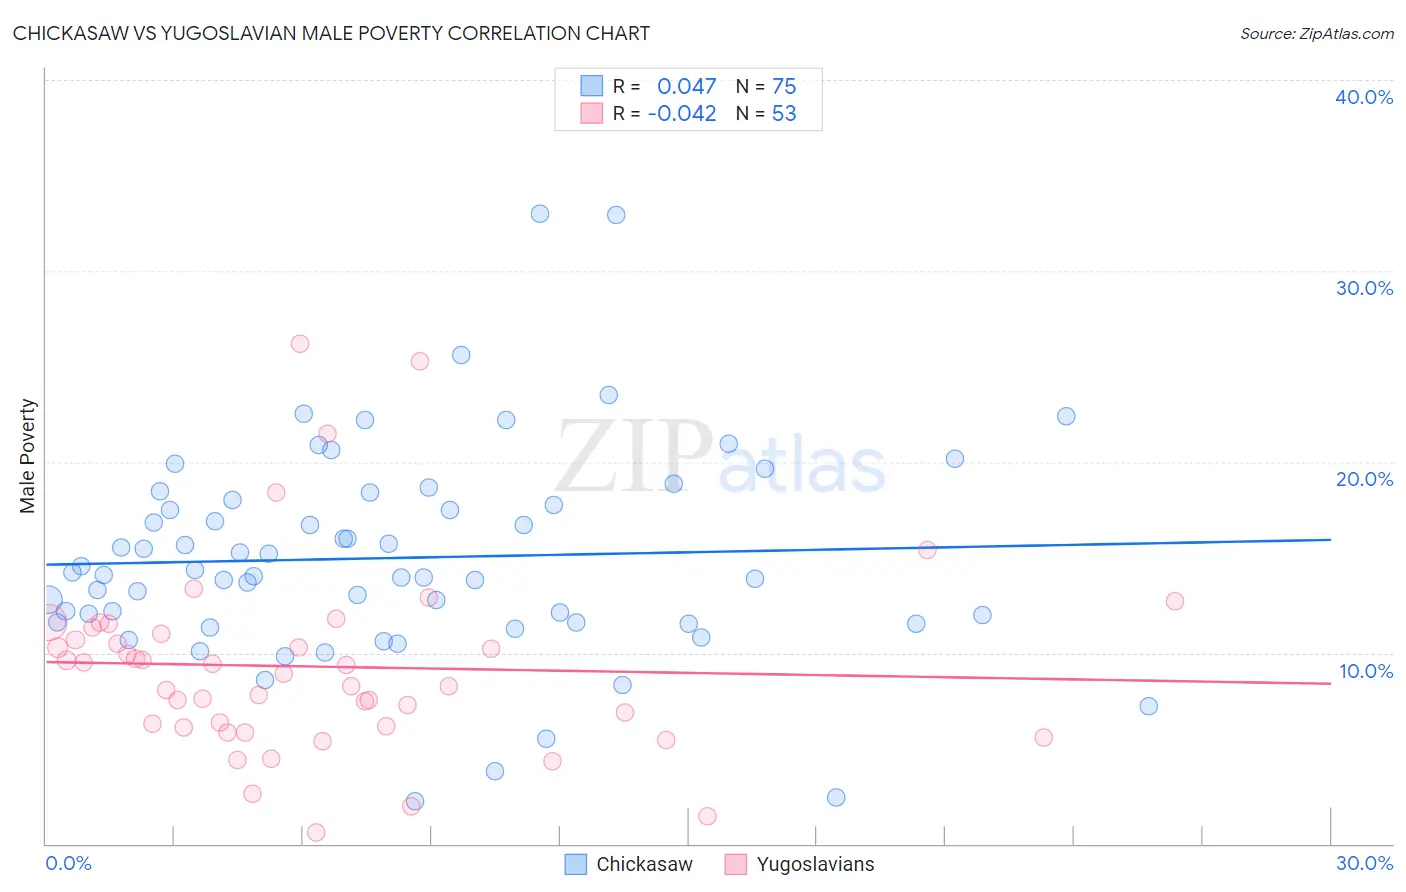
Chickasaw vs Yugoslavian Male Poverty Correlation Chart
The statistical analysis conducted on geographies consisting of 147,660,855 people shows no correlation between the proportion of Chickasaw and poverty level among males in the United States with a correlation coefficient (R) of 0.047 and weighted average of 13.5%. Similarly, the statistical analysis conducted on geographies consisting of 285,576,958 people shows no correlation between the proportion of Yugoslavians and poverty level among males in the United States with a correlation coefficient (R) of -0.042 and weighted average of 10.8%, a difference of 24.5%.
Male Poverty Correlation Summary
| Measurement | Chickasaw | Yugoslavian |
| Minimum | 2.2% | 0.59% |
| Maximum | 33.0% | 26.2% |
| Range | 30.8% | 25.6% |
| Mean | 15.0% | 9.3% |
| Median | 14.0% | 8.9% |
| Interquartile 25% (IQ1) | 11.6% | 6.1% |
| Interquartile 75% (IQ3) | 18.0% | 11.1% |
| Interquartile Range (IQR) | 6.4% | 5.0% |
| Standard Deviation (Sample) | 5.6% | 5.1% |
| Standard Deviation (Population) | 5.5% | 5.0% |
Similar Demographics by Male Poverty
Demographics Similar to Chickasaw by Male Poverty
In terms of male poverty, the demographic groups most similar to Chickasaw are Immigrants from West Indies (13.5%, a difference of 0.070%), Immigrants from Bahamas (13.5%, a difference of 0.29%), Barbadian (13.6%, a difference of 0.70%), Immigrants from Latin America (13.6%, a difference of 0.89%), and Bangladeshi (13.6%, a difference of 1.0%).
| Demographics | Rating | Rank | Male Poverty |
| Immigrants | Guyana | 0.1 /100 | #266 | Tragic 13.2% |
| Immigrants | Jamaica | 0.1 /100 | #267 | Tragic 13.3% |
| Sub-Saharan Africans | 0.1 /100 | #268 | Tragic 13.3% |
| Guyanese | 0.0 /100 | #269 | Tragic 13.3% |
| Cree | 0.0 /100 | #270 | Tragic 13.3% |
| Spanish Americans | 0.0 /100 | #271 | Tragic 13.4% |
| Immigrants | Bahamas | 0.0 /100 | #272 | Tragic 13.5% |
| Chickasaw | 0.0 /100 | #273 | Tragic 13.5% |
| Immigrants | West Indies | 0.0 /100 | #274 | Tragic 13.5% |
| Barbadians | 0.0 /100 | #275 | Tragic 13.6% |
| Immigrants | Latin America | 0.0 /100 | #276 | Tragic 13.6% |
| Bangladeshis | 0.0 /100 | #277 | Tragic 13.6% |
| Belizeans | 0.0 /100 | #278 | Tragic 13.6% |
| Haitians | 0.0 /100 | #279 | Tragic 13.7% |
| Mexicans | 0.0 /100 | #280 | Tragic 13.7% |
Demographics Similar to Yugoslavians by Male Poverty
In terms of male poverty, the demographic groups most similar to Yugoslavians are Immigrants from Jordan (10.8%, a difference of 0.12%), Immigrants from Switzerland (10.8%, a difference of 0.15%), Tlingit-Haida (10.9%, a difference of 0.31%), Immigrants from France (10.9%, a difference of 0.34%), and Immigrants from Israel (10.8%, a difference of 0.42%).
| Demographics | Rating | Rank | Male Poverty |
| Immigrants | Belarus | 83.3 /100 | #131 | Excellent 10.7% |
| Immigrants | Vietnam | 83.0 /100 | #132 | Excellent 10.8% |
| Pakistanis | 83.0 /100 | #133 | Excellent 10.8% |
| New Zealanders | 82.9 /100 | #134 | Excellent 10.8% |
| Brazilians | 82.7 /100 | #135 | Excellent 10.8% |
| Immigrants | Israel | 80.9 /100 | #136 | Excellent 10.8% |
| Immigrants | Switzerland | 79.2 /100 | #137 | Good 10.8% |
| Yugoslavians | 78.2 /100 | #138 | Good 10.8% |
| Immigrants | Jordan | 77.5 /100 | #139 | Good 10.8% |
| Tlingit-Haida | 76.1 /100 | #140 | Good 10.9% |
| Immigrants | France | 75.8 /100 | #141 | Good 10.9% |
| Basques | 74.6 /100 | #142 | Good 10.9% |
| Afghans | 71.9 /100 | #143 | Good 10.9% |
| Samoans | 71.8 /100 | #144 | Good 10.9% |
| Immigrants | Germany | 71.6 /100 | #145 | Good 10.9% |