Immigrants from Nigeria vs Yugoslavian Male Poverty
COMPARE
Immigrants from Nigeria
Yugoslavian
Male Poverty
Male Poverty Comparison
Immigrants from Nigeria
Yugoslavians
12.3%
MALE POVERTY
1.6/ 100
METRIC RATING
224th/ 347
METRIC RANK
10.8%
MALE POVERTY
78.2/ 100
METRIC RATING
138th/ 347
METRIC RANK
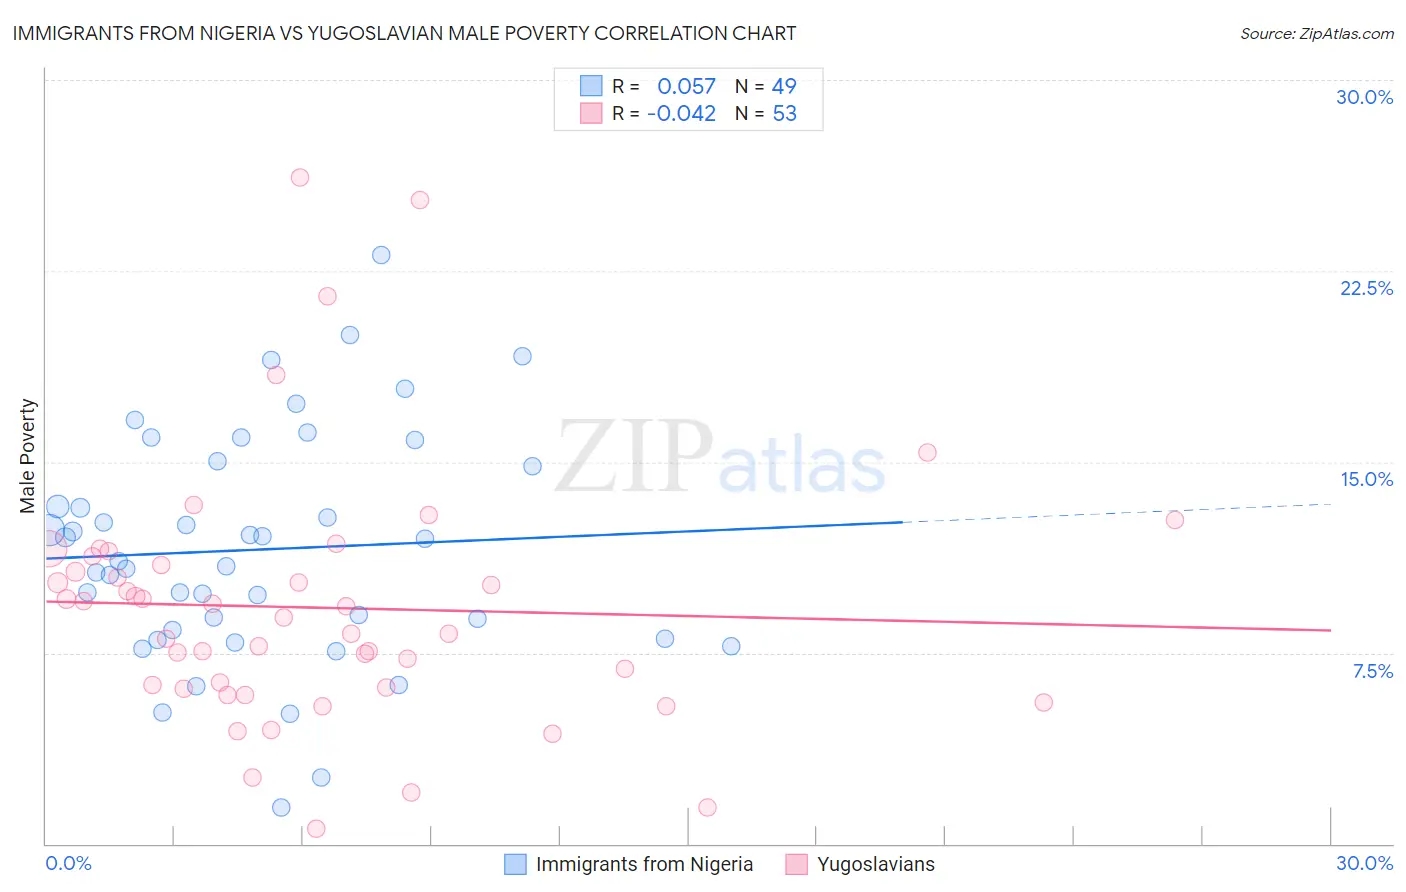
Immigrants from Nigeria vs Yugoslavian Male Poverty Correlation Chart
The statistical analysis conducted on geographies consisting of 283,241,379 people shows a slight positive correlation between the proportion of Immigrants from Nigeria and poverty level among males in the United States with a correlation coefficient (R) of 0.057 and weighted average of 12.3%. Similarly, the statistical analysis conducted on geographies consisting of 285,576,958 people shows no correlation between the proportion of Yugoslavians and poverty level among males in the United States with a correlation coefficient (R) of -0.042 and weighted average of 10.8%, a difference of 13.7%.
Male Poverty Correlation Summary
| Measurement | Immigrants from Nigeria | Yugoslavian |
| Minimum | 1.4% | 0.59% |
| Maximum | 23.1% | 26.2% |
| Range | 21.7% | 25.6% |
| Mean | 11.6% | 9.3% |
| Median | 11.1% | 8.9% |
| Interquartile 25% (IQ1) | 8.2% | 6.1% |
| Interquartile 75% (IQ3) | 14.9% | 11.1% |
| Interquartile Range (IQR) | 6.7% | 5.0% |
| Standard Deviation (Sample) | 4.5% | 5.1% |
| Standard Deviation (Population) | 4.5% | 5.0% |
Similar Demographics by Male Poverty
Demographics Similar to Immigrants from Nigeria by Male Poverty
In terms of male poverty, the demographic groups most similar to Immigrants from Nigeria are Osage (12.3%, a difference of 0.060%), Nigerian (12.3%, a difference of 0.22%), Alaska Native (12.4%, a difference of 0.32%), Alsatian (12.4%, a difference of 0.36%), and Cuban (12.4%, a difference of 0.45%).
| Demographics | Rating | Rank | Male Poverty |
| Immigrants | Thailand | 2.5 /100 | #217 | Tragic 12.2% |
| German Russians | 2.5 /100 | #218 | Tragic 12.2% |
| Bermudans | 2.4 /100 | #219 | Tragic 12.2% |
| Immigrants | Eritrea | 2.4 /100 | #220 | Tragic 12.2% |
| Ugandans | 2.2 /100 | #221 | Tragic 12.2% |
| Immigrants | Africa | 2.1 /100 | #222 | Tragic 12.2% |
| Immigrants | Micronesia | 2.1 /100 | #223 | Tragic 12.2% |
| Immigrants | Nigeria | 1.6 /100 | #224 | Tragic 12.3% |
| Osage | 1.5 /100 | #225 | Tragic 12.3% |
| Nigerians | 1.4 /100 | #226 | Tragic 12.3% |
| Alaska Natives | 1.4 /100 | #227 | Tragic 12.4% |
| Alsatians | 1.3 /100 | #228 | Tragic 12.4% |
| Cubans | 1.3 /100 | #229 | Tragic 12.4% |
| Marshallese | 0.8 /100 | #230 | Tragic 12.5% |
| Salvadorans | 0.6 /100 | #231 | Tragic 12.6% |
Demographics Similar to Yugoslavians by Male Poverty
In terms of male poverty, the demographic groups most similar to Yugoslavians are Immigrants from Jordan (10.8%, a difference of 0.12%), Immigrants from Switzerland (10.8%, a difference of 0.15%), Tlingit-Haida (10.9%, a difference of 0.31%), Immigrants from France (10.9%, a difference of 0.34%), and Immigrants from Israel (10.8%, a difference of 0.42%).
| Demographics | Rating | Rank | Male Poverty |
| Immigrants | Belarus | 83.3 /100 | #131 | Excellent 10.7% |
| Immigrants | Vietnam | 83.0 /100 | #132 | Excellent 10.8% |
| Pakistanis | 83.0 /100 | #133 | Excellent 10.8% |
| New Zealanders | 82.9 /100 | #134 | Excellent 10.8% |
| Brazilians | 82.7 /100 | #135 | Excellent 10.8% |
| Immigrants | Israel | 80.9 /100 | #136 | Excellent 10.8% |
| Immigrants | Switzerland | 79.2 /100 | #137 | Good 10.8% |
| Yugoslavians | 78.2 /100 | #138 | Good 10.8% |
| Immigrants | Jordan | 77.5 /100 | #139 | Good 10.8% |
| Tlingit-Haida | 76.1 /100 | #140 | Good 10.9% |
| Immigrants | France | 75.8 /100 | #141 | Good 10.9% |
| Basques | 74.6 /100 | #142 | Good 10.9% |
| Afghans | 71.9 /100 | #143 | Good 10.9% |
| Samoans | 71.8 /100 | #144 | Good 10.9% |
| Immigrants | Germany | 71.6 /100 | #145 | Good 10.9% |