English vs Yugoslavian Male Poverty
COMPARE
English
Yugoslavian
Male Poverty
Male Poverty Comparison
English
Yugoslavians
10.3%
MALE POVERTY
96.4/ 100
METRIC RATING
80th/ 347
METRIC RANK
10.8%
MALE POVERTY
78.2/ 100
METRIC RATING
138th/ 347
METRIC RANK
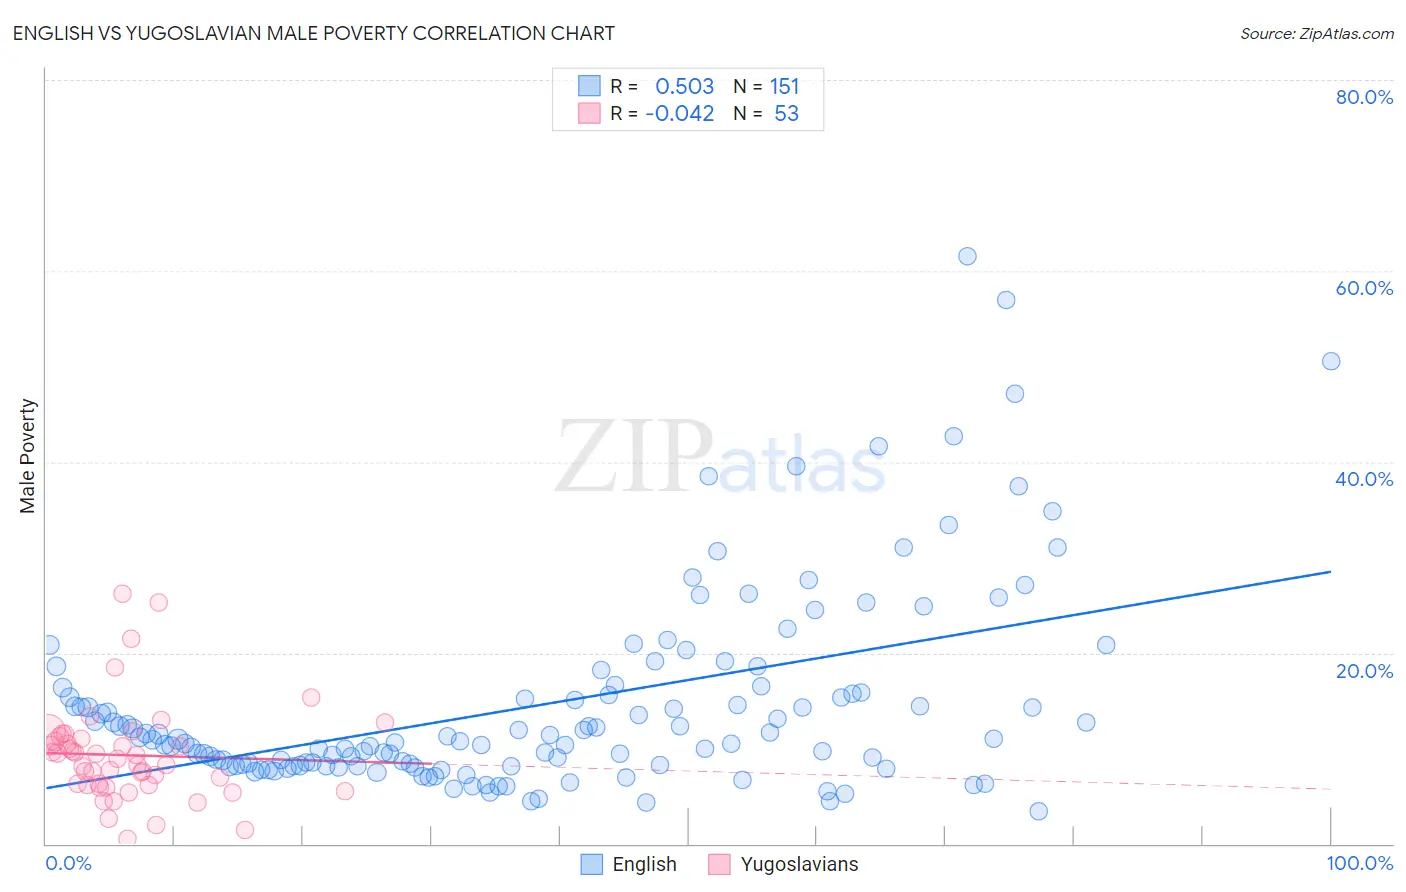
English vs Yugoslavian Male Poverty Correlation Chart
The statistical analysis conducted on geographies consisting of 577,651,479 people shows a substantial positive correlation between the proportion of English and poverty level among males in the United States with a correlation coefficient (R) of 0.503 and weighted average of 10.3%. Similarly, the statistical analysis conducted on geographies consisting of 285,576,958 people shows no correlation between the proportion of Yugoslavians and poverty level among males in the United States with a correlation coefficient (R) of -0.042 and weighted average of 10.8%, a difference of 5.4%.
Male Poverty Correlation Summary
| Measurement | English | Yugoslavian |
| Minimum | 3.5% | 0.59% |
| Maximum | 61.6% | 26.2% |
| Range | 58.1% | 25.6% |
| Mean | 14.6% | 9.3% |
| Median | 10.9% | 8.9% |
| Interquartile 25% (IQ1) | 8.2% | 6.1% |
| Interquartile 75% (IQ3) | 15.8% | 11.1% |
| Interquartile Range (IQR) | 7.7% | 5.0% |
| Standard Deviation (Sample) | 10.4% | 5.1% |
| Standard Deviation (Population) | 10.4% | 5.0% |
Similar Demographics by Male Poverty
Demographics Similar to English by Male Poverty
In terms of male poverty, the demographic groups most similar to English are Immigrants from North America (10.3%, a difference of 0.080%), Irish (10.3%, a difference of 0.32%), Immigrants from Belgium (10.3%, a difference of 0.34%), Dutch (10.2%, a difference of 0.37%), and Immigrants from Eastern Europe (10.2%, a difference of 0.38%).
| Demographics | Rating | Rank | Male Poverty |
| Immigrants | Asia | 97.0 /100 | #73 | Exceptional 10.2% |
| Immigrants | Eastern Europe | 96.9 /100 | #74 | Exceptional 10.2% |
| Carpatho Rusyns | 96.9 /100 | #75 | Exceptional 10.2% |
| Dutch | 96.9 /100 | #76 | Exceptional 10.2% |
| Immigrants | Belgium | 96.8 /100 | #77 | Exceptional 10.3% |
| Irish | 96.8 /100 | #78 | Exceptional 10.3% |
| Immigrants | North America | 96.5 /100 | #79 | Exceptional 10.3% |
| English | 96.4 /100 | #80 | Exceptional 10.3% |
| Belgians | 95.9 /100 | #81 | Exceptional 10.3% |
| Egyptians | 95.9 /100 | #82 | Exceptional 10.3% |
| Immigrants | Sweden | 95.7 /100 | #83 | Exceptional 10.3% |
| Czechoslovakians | 95.6 /100 | #84 | Exceptional 10.3% |
| Immigrants | England | 95.5 /100 | #85 | Exceptional 10.4% |
| Immigrants | Eastern Asia | 95.3 /100 | #86 | Exceptional 10.4% |
| Northern Europeans | 95.2 /100 | #87 | Exceptional 10.4% |
Demographics Similar to Yugoslavians by Male Poverty
In terms of male poverty, the demographic groups most similar to Yugoslavians are Immigrants from Jordan (10.8%, a difference of 0.12%), Immigrants from Switzerland (10.8%, a difference of 0.15%), Tlingit-Haida (10.9%, a difference of 0.31%), Immigrants from France (10.9%, a difference of 0.34%), and Immigrants from Israel (10.8%, a difference of 0.42%).
| Demographics | Rating | Rank | Male Poverty |
| Immigrants | Belarus | 83.3 /100 | #131 | Excellent 10.7% |
| Immigrants | Vietnam | 83.0 /100 | #132 | Excellent 10.8% |
| Pakistanis | 83.0 /100 | #133 | Excellent 10.8% |
| New Zealanders | 82.9 /100 | #134 | Excellent 10.8% |
| Brazilians | 82.7 /100 | #135 | Excellent 10.8% |
| Immigrants | Israel | 80.9 /100 | #136 | Excellent 10.8% |
| Immigrants | Switzerland | 79.2 /100 | #137 | Good 10.8% |
| Yugoslavians | 78.2 /100 | #138 | Good 10.8% |
| Immigrants | Jordan | 77.5 /100 | #139 | Good 10.8% |
| Tlingit-Haida | 76.1 /100 | #140 | Good 10.9% |
| Immigrants | France | 75.8 /100 | #141 | Good 10.9% |
| Basques | 74.6 /100 | #142 | Good 10.9% |
| Afghans | 71.9 /100 | #143 | Good 10.9% |
| Samoans | 71.8 /100 | #144 | Good 10.9% |
| Immigrants | Germany | 71.6 /100 | #145 | Good 10.9% |