Celtic vs Immigrants from Turkey Poverty
COMPARE
Celtic
Immigrants from Turkey
Poverty
Poverty Comparison
Celtics
Immigrants from Turkey
12.3%
POVERTY
50.1/ 100
METRIC RATING
173rd/ 347
METRIC RANK
11.6%
POVERTY
91.7/ 100
METRIC RATING
109th/ 347
METRIC RANK
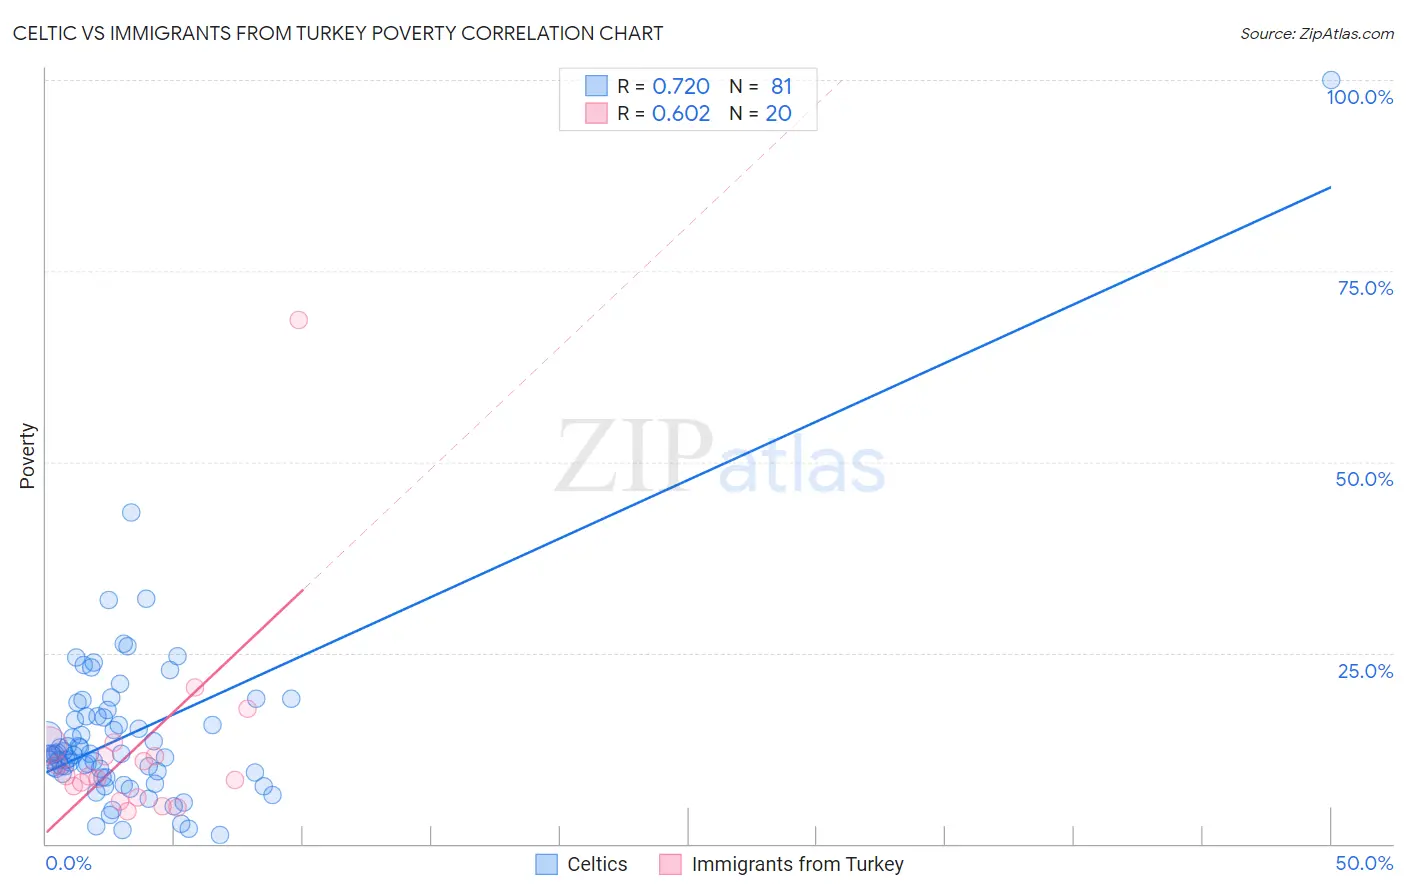
Celtic vs Immigrants from Turkey Poverty Correlation Chart
The statistical analysis conducted on geographies consisting of 168,858,616 people shows a strong positive correlation between the proportion of Celtics and poverty level in the United States with a correlation coefficient (R) of 0.720 and weighted average of 12.3%. Similarly, the statistical analysis conducted on geographies consisting of 222,977,543 people shows a significant positive correlation between the proportion of Immigrants from Turkey and poverty level in the United States with a correlation coefficient (R) of 0.602 and weighted average of 11.6%, a difference of 6.2%.
Poverty Correlation Summary
| Measurement | Celtic | Immigrants from Turkey |
| Minimum | 1.1% | 4.2% |
| Maximum | 100.0% | 68.6% |
| Range | 98.9% | 64.4% |
| Mean | 14.3% | 12.6% |
| Median | 11.7% | 8.9% |
| Interquartile 25% (IQ1) | 9.3% | 6.8% |
| Interquartile 75% (IQ3) | 16.7% | 12.3% |
| Interquartile Range (IQR) | 7.4% | 5.4% |
| Standard Deviation (Sample) | 12.1% | 13.8% |
| Standard Deviation (Population) | 12.1% | 13.5% |
Similar Demographics by Poverty
Demographics Similar to Celtics by Poverty
In terms of poverty, the demographic groups most similar to Celtics are Lebanese (12.3%, a difference of 0.010%), Immigrants from Portugal (12.3%, a difference of 0.040%), Immigrants from Spain (12.3%, a difference of 0.11%), South American (12.3%, a difference of 0.14%), and Immigrants from Colombia (12.3%, a difference of 0.24%).
| Demographics | Rating | Rank | Poverty |
| Venezuelans | 56.9 /100 | #166 | Average 12.2% |
| Immigrants | Chile | 56.7 /100 | #167 | Average 12.2% |
| Immigrants | Venezuela | 56.5 /100 | #168 | Average 12.2% |
| Whites/Caucasians | 55.4 /100 | #169 | Average 12.3% |
| Immigrants | Oceania | 54.6 /100 | #170 | Average 12.3% |
| Immigrants | Spain | 51.3 /100 | #171 | Average 12.3% |
| Immigrants | Portugal | 50.5 /100 | #172 | Average 12.3% |
| Celtics | 50.1 /100 | #173 | Average 12.3% |
| Lebanese | 50.0 /100 | #174 | Average 12.3% |
| South Americans | 48.7 /100 | #175 | Average 12.3% |
| Immigrants | Colombia | 47.7 /100 | #176 | Average 12.3% |
| Immigrants | Syria | 47.5 /100 | #177 | Average 12.3% |
| Uruguayans | 44.7 /100 | #178 | Average 12.4% |
| Immigrants | Morocco | 44.0 /100 | #179 | Average 12.4% |
| Mongolians | 43.6 /100 | #180 | Average 12.4% |
Demographics Similar to Immigrants from Turkey by Poverty
In terms of poverty, the demographic groups most similar to Immigrants from Turkey are Canadian (11.6%, a difference of 0.010%), Welsh (11.6%, a difference of 0.040%), Palestinian (11.6%, a difference of 0.050%), Portuguese (11.6%, a difference of 0.14%), and Immigrants from Zimbabwe (11.6%, a difference of 0.14%).
| Demographics | Rating | Rank | Poverty |
| Laotians | 92.4 /100 | #102 | Exceptional 11.6% |
| Okinawans | 92.4 /100 | #103 | Exceptional 11.6% |
| Native Hawaiians | 92.1 /100 | #104 | Exceptional 11.6% |
| Portuguese | 92.1 /100 | #105 | Exceptional 11.6% |
| Immigrants | Zimbabwe | 92.1 /100 | #106 | Exceptional 11.6% |
| Palestinians | 91.8 /100 | #107 | Exceptional 11.6% |
| Canadians | 91.7 /100 | #108 | Exceptional 11.6% |
| Immigrants | Turkey | 91.7 /100 | #109 | Exceptional 11.6% |
| Welsh | 91.6 /100 | #110 | Exceptional 11.6% |
| French Canadians | 91.0 /100 | #111 | Exceptional 11.6% |
| Immigrants | Southern Europe | 90.8 /100 | #112 | Exceptional 11.6% |
| Immigrants | Belarus | 90.8 /100 | #113 | Exceptional 11.6% |
| Immigrants | China | 90.7 /100 | #114 | Exceptional 11.6% |
| Albanians | 90.3 /100 | #115 | Exceptional 11.7% |
| Immigrants | Russia | 89.7 /100 | #116 | Excellent 11.7% |