Immigrants from Colombia vs Immigrants from Turkey Poverty
COMPARE
Immigrants from Colombia
Immigrants from Turkey
Poverty
Poverty Comparison
Immigrants from Colombia
Immigrants from Turkey
12.3%
POVERTY
47.7/ 100
METRIC RATING
176th/ 347
METRIC RANK
11.6%
POVERTY
91.7/ 100
METRIC RATING
109th/ 347
METRIC RANK
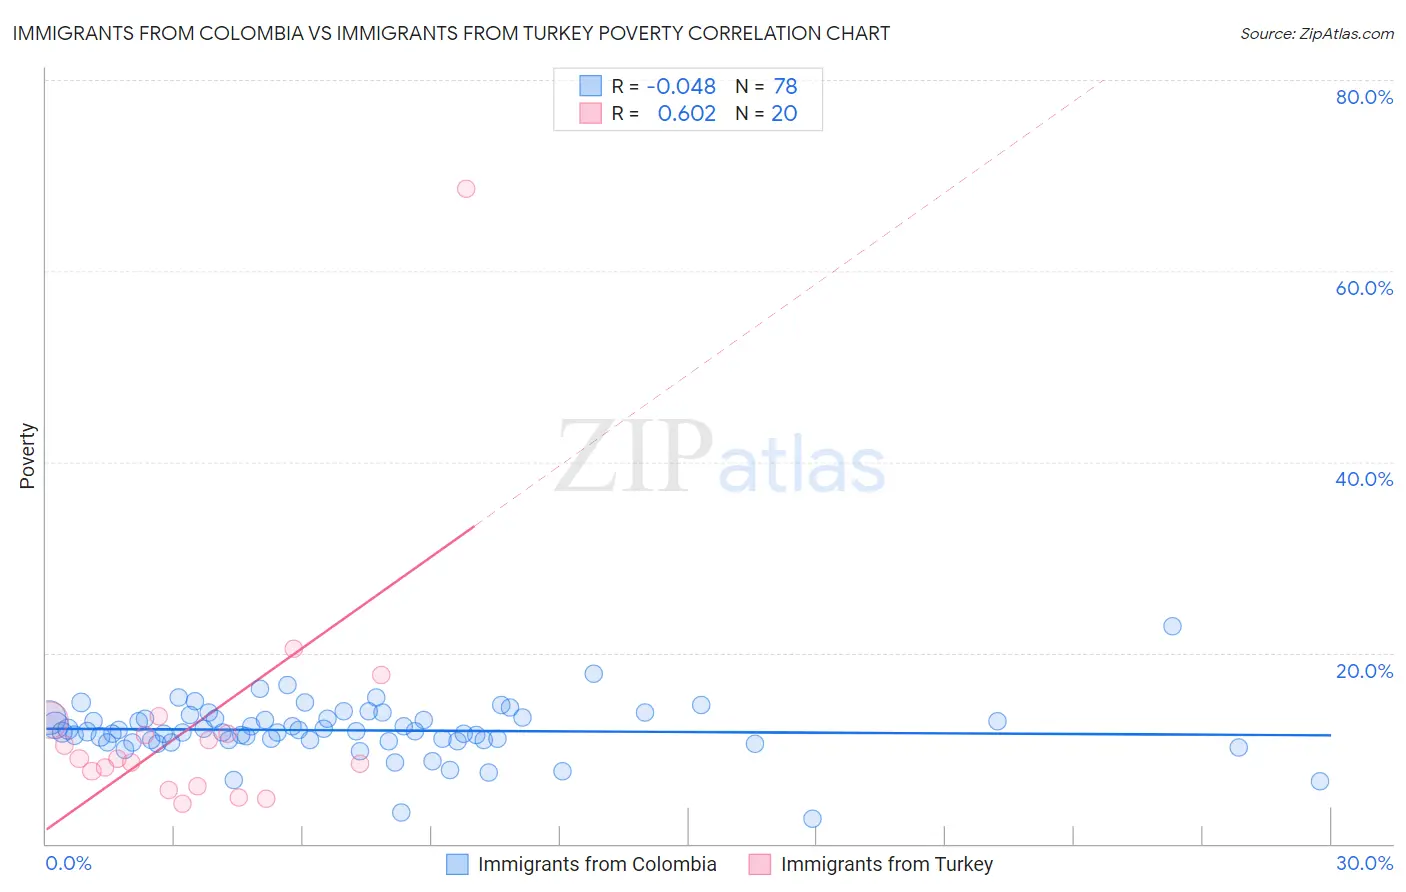
Immigrants from Colombia vs Immigrants from Turkey Poverty Correlation Chart
The statistical analysis conducted on geographies consisting of 378,485,502 people shows no correlation between the proportion of Immigrants from Colombia and poverty level in the United States with a correlation coefficient (R) of -0.048 and weighted average of 12.3%. Similarly, the statistical analysis conducted on geographies consisting of 222,977,543 people shows a significant positive correlation between the proportion of Immigrants from Turkey and poverty level in the United States with a correlation coefficient (R) of 0.602 and weighted average of 11.6%, a difference of 6.4%.
Poverty Correlation Summary
| Measurement | Immigrants from Colombia | Immigrants from Turkey |
| Minimum | 2.6% | 4.2% |
| Maximum | 22.8% | 68.6% |
| Range | 20.2% | 64.4% |
| Mean | 11.9% | 12.6% |
| Median | 11.8% | 8.9% |
| Interquartile 25% (IQ1) | 10.8% | 6.8% |
| Interquartile 75% (IQ3) | 13.2% | 12.3% |
| Interquartile Range (IQR) | 2.3% | 5.4% |
| Standard Deviation (Sample) | 2.8% | 13.8% |
| Standard Deviation (Population) | 2.8% | 13.5% |
Similar Demographics by Poverty
Demographics Similar to Immigrants from Colombia by Poverty
In terms of poverty, the demographic groups most similar to Immigrants from Colombia are Immigrants from Syria (12.3%, a difference of 0.020%), South American (12.3%, a difference of 0.090%), Lebanese (12.3%, a difference of 0.23%), Celtic (12.3%, a difference of 0.24%), and Immigrants from Portugal (12.3%, a difference of 0.28%).
| Demographics | Rating | Rank | Poverty |
| Whites/Caucasians | 55.4 /100 | #169 | Average 12.3% |
| Immigrants | Oceania | 54.6 /100 | #170 | Average 12.3% |
| Immigrants | Spain | 51.3 /100 | #171 | Average 12.3% |
| Immigrants | Portugal | 50.5 /100 | #172 | Average 12.3% |
| Celtics | 50.1 /100 | #173 | Average 12.3% |
| Lebanese | 50.0 /100 | #174 | Average 12.3% |
| South Americans | 48.7 /100 | #175 | Average 12.3% |
| Immigrants | Colombia | 47.7 /100 | #176 | Average 12.3% |
| Immigrants | Syria | 47.5 /100 | #177 | Average 12.3% |
| Uruguayans | 44.7 /100 | #178 | Average 12.4% |
| Immigrants | Morocco | 44.0 /100 | #179 | Average 12.4% |
| Mongolians | 43.6 /100 | #180 | Average 12.4% |
| Immigrants | Afghanistan | 42.1 /100 | #181 | Average 12.4% |
| Immigrants | Cameroon | 41.7 /100 | #182 | Average 12.4% |
| Immigrants | Iraq | 40.2 /100 | #183 | Average 12.4% |
Demographics Similar to Immigrants from Turkey by Poverty
In terms of poverty, the demographic groups most similar to Immigrants from Turkey are Canadian (11.6%, a difference of 0.010%), Welsh (11.6%, a difference of 0.040%), Palestinian (11.6%, a difference of 0.050%), Portuguese (11.6%, a difference of 0.14%), and Immigrants from Zimbabwe (11.6%, a difference of 0.14%).
| Demographics | Rating | Rank | Poverty |
| Laotians | 92.4 /100 | #102 | Exceptional 11.6% |
| Okinawans | 92.4 /100 | #103 | Exceptional 11.6% |
| Native Hawaiians | 92.1 /100 | #104 | Exceptional 11.6% |
| Portuguese | 92.1 /100 | #105 | Exceptional 11.6% |
| Immigrants | Zimbabwe | 92.1 /100 | #106 | Exceptional 11.6% |
| Palestinians | 91.8 /100 | #107 | Exceptional 11.6% |
| Canadians | 91.7 /100 | #108 | Exceptional 11.6% |
| Immigrants | Turkey | 91.7 /100 | #109 | Exceptional 11.6% |
| Welsh | 91.6 /100 | #110 | Exceptional 11.6% |
| French Canadians | 91.0 /100 | #111 | Exceptional 11.6% |
| Immigrants | Southern Europe | 90.8 /100 | #112 | Exceptional 11.6% |
| Immigrants | Belarus | 90.8 /100 | #113 | Exceptional 11.6% |
| Immigrants | China | 90.7 /100 | #114 | Exceptional 11.6% |
| Albanians | 90.3 /100 | #115 | Exceptional 11.7% |
| Immigrants | Russia | 89.7 /100 | #116 | Excellent 11.7% |