Uruguayan vs Immigrants from Cabo Verde Poverty
COMPARE
Uruguayan
Immigrants from Cabo Verde
Poverty
Poverty Comparison
Uruguayans
Immigrants from Cabo Verde
12.4%
POVERTY
44.7/ 100
METRIC RATING
178th/ 347
METRIC RANK
15.1%
POVERTY
0.0/ 100
METRIC RATING
291st/ 347
METRIC RANK
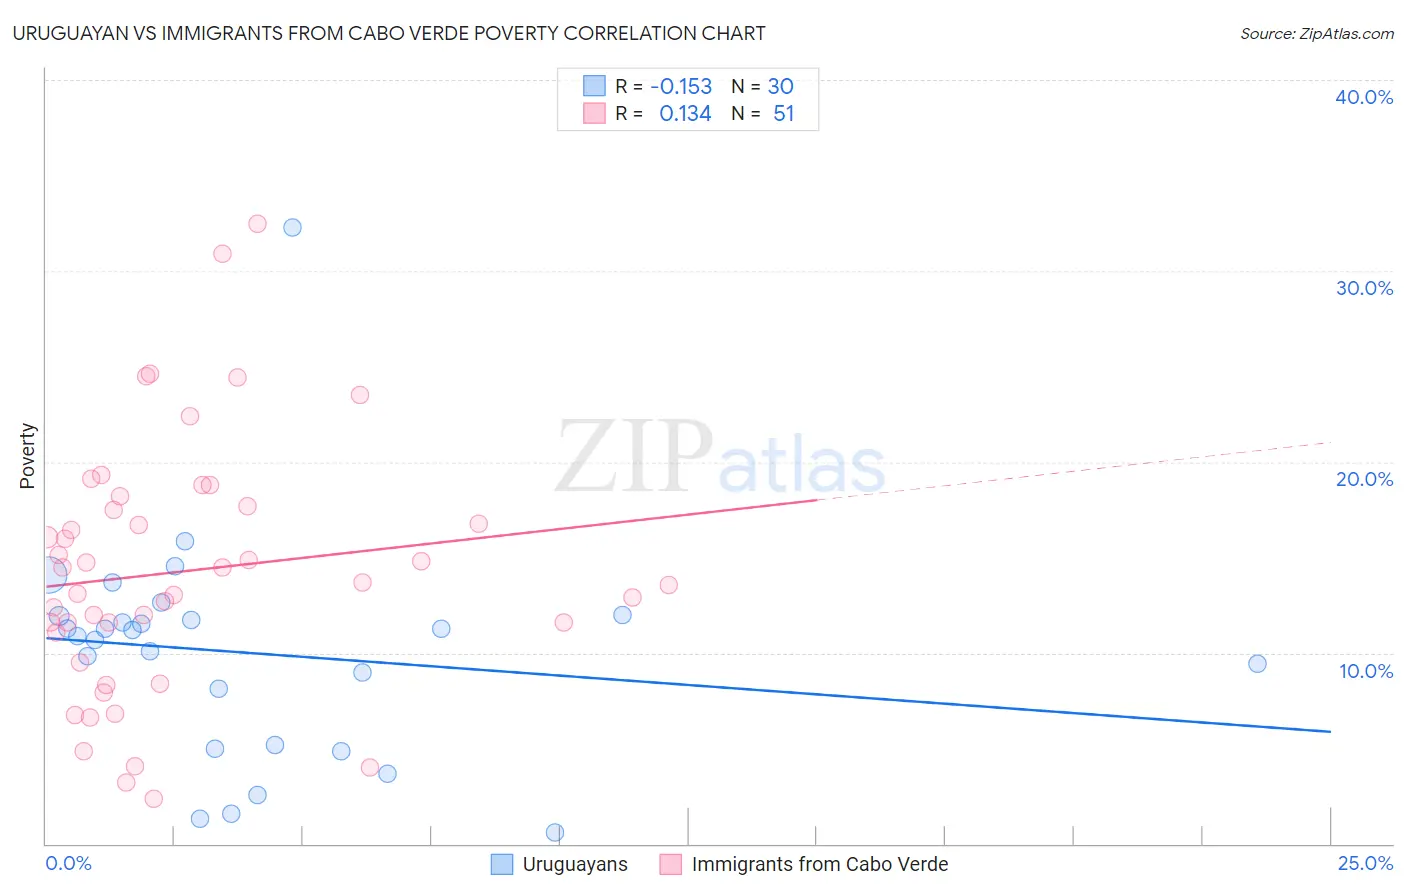
Uruguayan vs Immigrants from Cabo Verde Poverty Correlation Chart
The statistical analysis conducted on geographies consisting of 144,767,930 people shows a poor negative correlation between the proportion of Uruguayans and poverty level in the United States with a correlation coefficient (R) of -0.153 and weighted average of 12.4%. Similarly, the statistical analysis conducted on geographies consisting of 38,149,486 people shows a poor positive correlation between the proportion of Immigrants from Cabo Verde and poverty level in the United States with a correlation coefficient (R) of 0.134 and weighted average of 15.1%, a difference of 22.1%.
Poverty Correlation Summary
| Measurement | Uruguayan | Immigrants from Cabo Verde |
| Minimum | 0.58% | 2.3% |
| Maximum | 32.3% | 32.5% |
| Range | 31.7% | 30.1% |
| Mean | 10.0% | 14.3% |
| Median | 11.0% | 13.7% |
| Interquartile 25% (IQ1) | 5.2% | 11.0% |
| Interquartile 75% (IQ3) | 11.9% | 17.6% |
| Interquartile Range (IQR) | 6.8% | 6.6% |
| Standard Deviation (Sample) | 5.9% | 6.6% |
| Standard Deviation (Population) | 5.8% | 6.5% |
Similar Demographics by Poverty
Demographics Similar to Uruguayans by Poverty
In terms of poverty, the demographic groups most similar to Uruguayans are Immigrants from Morocco (12.4%, a difference of 0.060%), Mongolian (12.4%, a difference of 0.10%), Immigrants from Afghanistan (12.4%, a difference of 0.25%), Immigrants from Syria (12.3%, a difference of 0.27%), and Immigrants from Colombia (12.3%, a difference of 0.29%).
| Demographics | Rating | Rank | Poverty |
| Immigrants | Spain | 51.3 /100 | #171 | Average 12.3% |
| Immigrants | Portugal | 50.5 /100 | #172 | Average 12.3% |
| Celtics | 50.1 /100 | #173 | Average 12.3% |
| Lebanese | 50.0 /100 | #174 | Average 12.3% |
| South Americans | 48.7 /100 | #175 | Average 12.3% |
| Immigrants | Colombia | 47.7 /100 | #176 | Average 12.3% |
| Immigrants | Syria | 47.5 /100 | #177 | Average 12.3% |
| Uruguayans | 44.7 /100 | #178 | Average 12.4% |
| Immigrants | Morocco | 44.0 /100 | #179 | Average 12.4% |
| Mongolians | 43.6 /100 | #180 | Average 12.4% |
| Immigrants | Afghanistan | 42.1 /100 | #181 | Average 12.4% |
| Immigrants | Cameroon | 41.7 /100 | #182 | Average 12.4% |
| Immigrants | Iraq | 40.2 /100 | #183 | Average 12.4% |
| Kenyans | 38.8 /100 | #184 | Fair 12.5% |
| Israelis | 36.4 /100 | #185 | Fair 12.5% |
Demographics Similar to Immigrants from Cabo Verde by Poverty
In terms of poverty, the demographic groups most similar to Immigrants from Cabo Verde are Indonesian (15.1%, a difference of 0.050%), Immigrants from Zaire (15.1%, a difference of 0.060%), Mexican (15.1%, a difference of 0.13%), Immigrants from Belize (15.1%, a difference of 0.23%), and Yaqui (15.1%, a difference of 0.35%).
| Demographics | Rating | Rank | Poverty |
| West Indians | 0.0 /100 | #284 | Tragic 15.0% |
| Vietnamese | 0.0 /100 | #285 | Tragic 15.0% |
| Immigrants | Latin America | 0.0 /100 | #286 | Tragic 15.0% |
| Inupiat | 0.0 /100 | #287 | Tragic 15.1% |
| Yaqui | 0.0 /100 | #288 | Tragic 15.1% |
| Immigrants | Belize | 0.0 /100 | #289 | Tragic 15.1% |
| Mexicans | 0.0 /100 | #290 | Tragic 15.1% |
| Immigrants | Cabo Verde | 0.0 /100 | #291 | Tragic 15.1% |
| Indonesians | 0.0 /100 | #292 | Tragic 15.1% |
| Immigrants | Zaire | 0.0 /100 | #293 | Tragic 15.1% |
| Blackfeet | 0.0 /100 | #294 | Tragic 15.2% |
| Guatemalans | 0.0 /100 | #295 | Tragic 15.3% |
| Hispanics or Latinos | 0.0 /100 | #296 | Tragic 15.3% |
| Immigrants | Bangladesh | 0.0 /100 | #297 | Tragic 15.3% |
| Immigrants | Senegal | 0.0 /100 | #298 | Tragic 15.3% |