Luxembourger vs Immigrants from Cabo Verde Poverty
COMPARE
Luxembourger
Immigrants from Cabo Verde
Poverty
Poverty Comparison
Luxembourgers
Immigrants from Cabo Verde
10.6%
POVERTY
99.7/ 100
METRIC RATING
21st/ 347
METRIC RANK
15.1%
POVERTY
0.0/ 100
METRIC RATING
291st/ 347
METRIC RANK
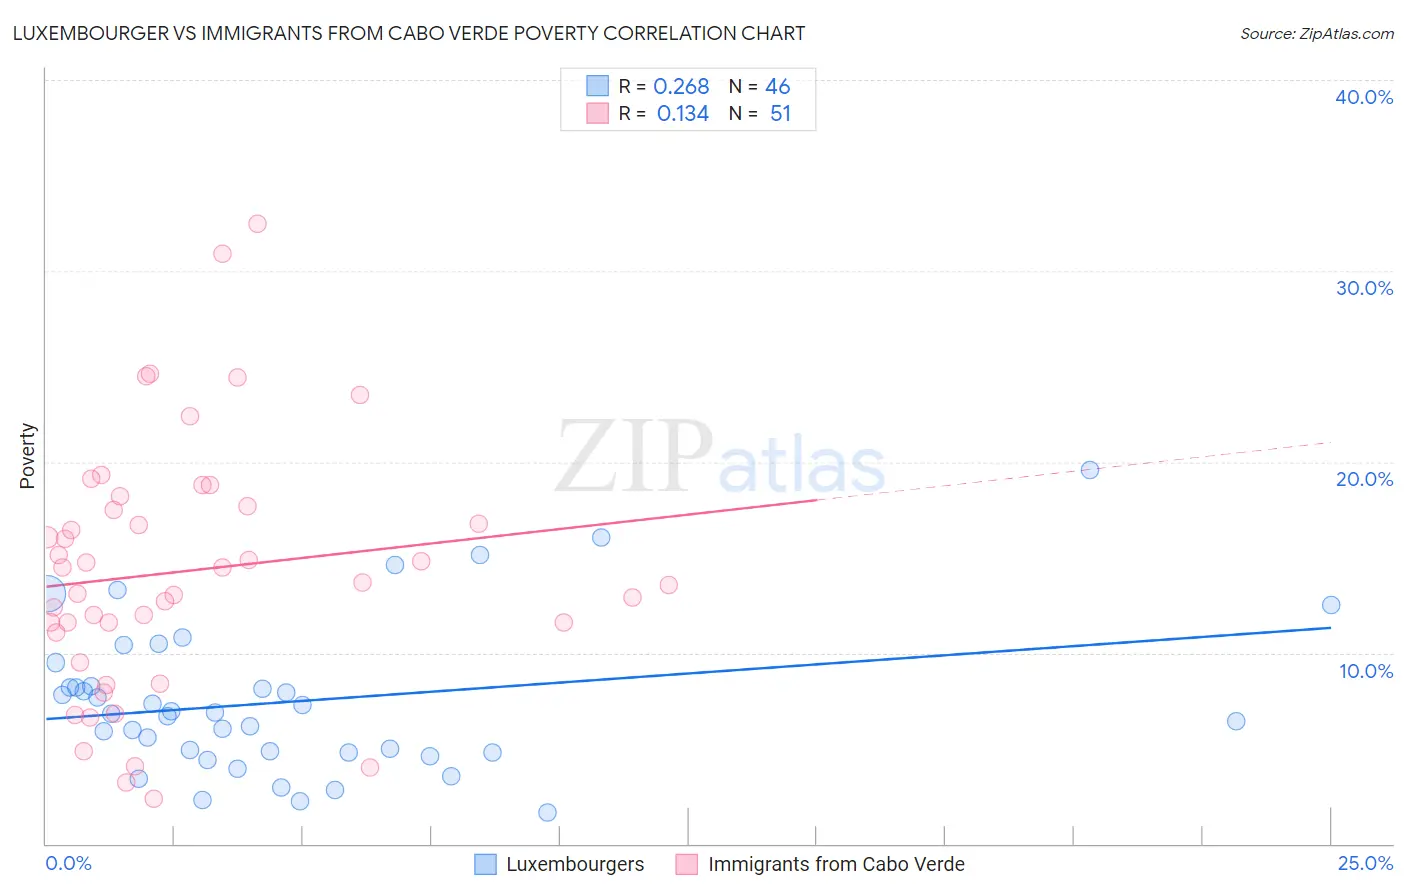
Luxembourger vs Immigrants from Cabo Verde Poverty Correlation Chart
The statistical analysis conducted on geographies consisting of 144,648,044 people shows a weak positive correlation between the proportion of Luxembourgers and poverty level in the United States with a correlation coefficient (R) of 0.268 and weighted average of 10.6%. Similarly, the statistical analysis conducted on geographies consisting of 38,149,486 people shows a poor positive correlation between the proportion of Immigrants from Cabo Verde and poverty level in the United States with a correlation coefficient (R) of 0.134 and weighted average of 15.1%, a difference of 42.9%.
Poverty Correlation Summary
| Measurement | Luxembourger | Immigrants from Cabo Verde |
| Minimum | 1.6% | 2.3% |
| Maximum | 19.5% | 32.5% |
| Range | 17.9% | 30.1% |
| Mean | 7.5% | 14.3% |
| Median | 6.8% | 13.7% |
| Interquartile 25% (IQ1) | 4.8% | 11.0% |
| Interquartile 75% (IQ3) | 8.3% | 17.6% |
| Interquartile Range (IQR) | 3.5% | 6.6% |
| Standard Deviation (Sample) | 3.9% | 6.6% |
| Standard Deviation (Population) | 3.9% | 6.5% |
Similar Demographics by Poverty
Demographics Similar to Luxembourgers by Poverty
In terms of poverty, the demographic groups most similar to Luxembourgers are Immigrants from North Macedonia (10.6%, a difference of 0.080%), Eastern European (10.6%, a difference of 0.16%), Immigrants from Scotland (10.6%, a difference of 0.19%), Swedish (10.6%, a difference of 0.27%), and Italian (10.6%, a difference of 0.31%).
| Demographics | Rating | Rank | Poverty |
| Immigrants | Bolivia | 99.8 /100 | #14 | Exceptional 10.4% |
| Bolivians | 99.8 /100 | #15 | Exceptional 10.4% |
| Lithuanians | 99.8 /100 | #16 | Exceptional 10.5% |
| Norwegians | 99.8 /100 | #17 | Exceptional 10.5% |
| Latvians | 99.8 /100 | #18 | Exceptional 10.5% |
| Immigrants | Scotland | 99.7 /100 | #19 | Exceptional 10.6% |
| Immigrants | North Macedonia | 99.7 /100 | #20 | Exceptional 10.6% |
| Luxembourgers | 99.7 /100 | #21 | Exceptional 10.6% |
| Eastern Europeans | 99.7 /100 | #22 | Exceptional 10.6% |
| Swedes | 99.7 /100 | #23 | Exceptional 10.6% |
| Italians | 99.7 /100 | #24 | Exceptional 10.6% |
| Croatians | 99.6 /100 | #25 | Exceptional 10.6% |
| Burmese | 99.6 /100 | #26 | Exceptional 10.7% |
| Immigrants | Northern Europe | 99.6 /100 | #27 | Exceptional 10.7% |
| Immigrants | Korea | 99.5 /100 | #28 | Exceptional 10.7% |
Demographics Similar to Immigrants from Cabo Verde by Poverty
In terms of poverty, the demographic groups most similar to Immigrants from Cabo Verde are Indonesian (15.1%, a difference of 0.050%), Immigrants from Zaire (15.1%, a difference of 0.060%), Mexican (15.1%, a difference of 0.13%), Immigrants from Belize (15.1%, a difference of 0.23%), and Yaqui (15.1%, a difference of 0.35%).
| Demographics | Rating | Rank | Poverty |
| West Indians | 0.0 /100 | #284 | Tragic 15.0% |
| Vietnamese | 0.0 /100 | #285 | Tragic 15.0% |
| Immigrants | Latin America | 0.0 /100 | #286 | Tragic 15.0% |
| Inupiat | 0.0 /100 | #287 | Tragic 15.1% |
| Yaqui | 0.0 /100 | #288 | Tragic 15.1% |
| Immigrants | Belize | 0.0 /100 | #289 | Tragic 15.1% |
| Mexicans | 0.0 /100 | #290 | Tragic 15.1% |
| Immigrants | Cabo Verde | 0.0 /100 | #291 | Tragic 15.1% |
| Indonesians | 0.0 /100 | #292 | Tragic 15.1% |
| Immigrants | Zaire | 0.0 /100 | #293 | Tragic 15.1% |
| Blackfeet | 0.0 /100 | #294 | Tragic 15.2% |
| Guatemalans | 0.0 /100 | #295 | Tragic 15.3% |
| Hispanics or Latinos | 0.0 /100 | #296 | Tragic 15.3% |
| Immigrants | Bangladesh | 0.0 /100 | #297 | Tragic 15.3% |
| Immigrants | Senegal | 0.0 /100 | #298 | Tragic 15.3% |