Sudanese vs Immigrants from Cabo Verde Poverty
COMPARE
Sudanese
Immigrants from Cabo Verde
Poverty
Poverty Comparison
Sudanese
Immigrants from Cabo Verde
14.0%
POVERTY
0.3/ 100
METRIC RATING
243rd/ 347
METRIC RANK
15.1%
POVERTY
0.0/ 100
METRIC RATING
291st/ 347
METRIC RANK
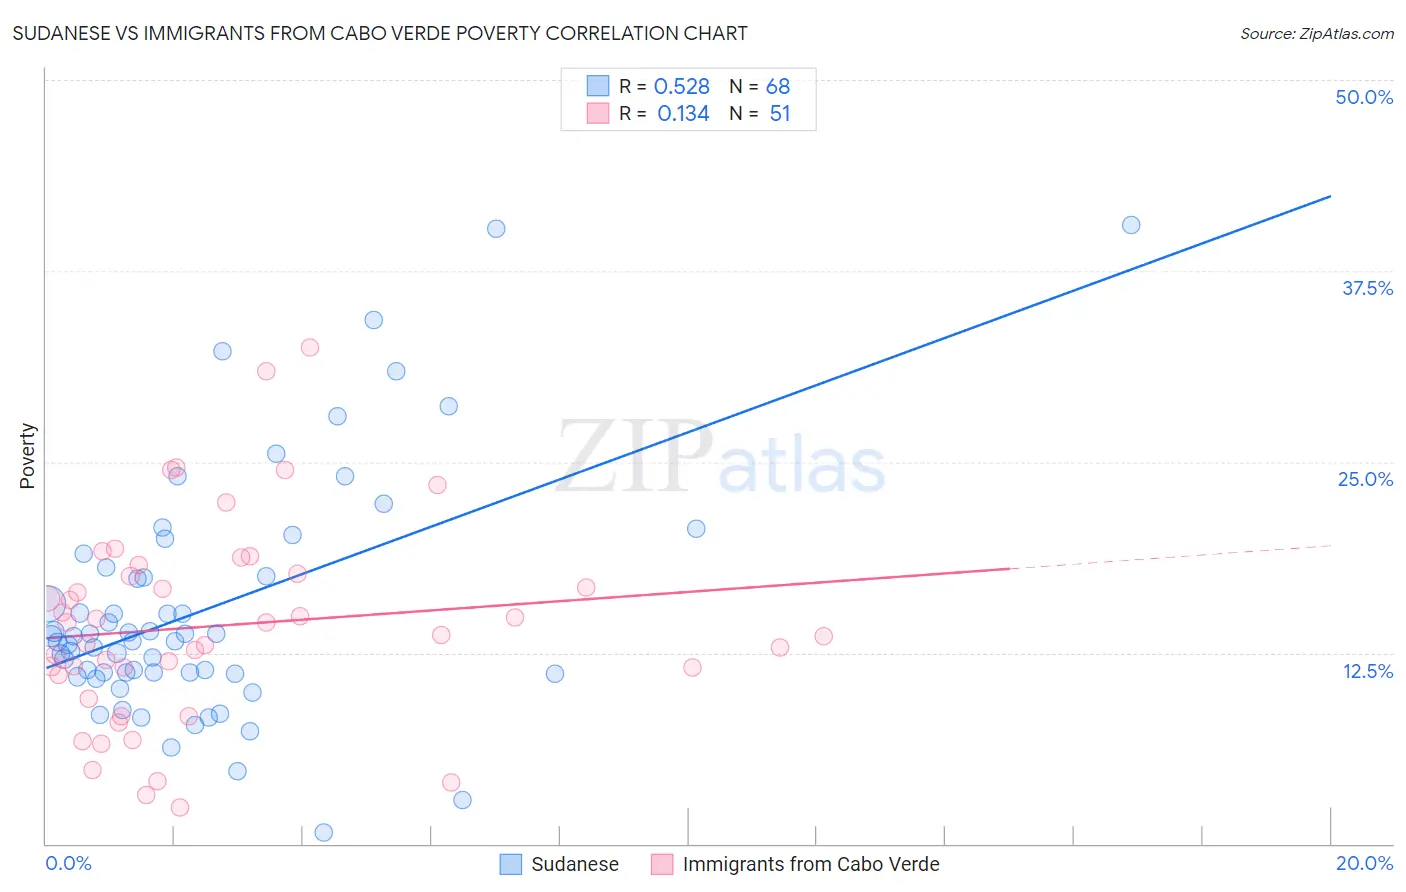
Sudanese vs Immigrants from Cabo Verde Poverty Correlation Chart
The statistical analysis conducted on geographies consisting of 110,120,634 people shows a substantial positive correlation between the proportion of Sudanese and poverty level in the United States with a correlation coefficient (R) of 0.528 and weighted average of 14.0%. Similarly, the statistical analysis conducted on geographies consisting of 38,149,486 people shows a poor positive correlation between the proportion of Immigrants from Cabo Verde and poverty level in the United States with a correlation coefficient (R) of 0.134 and weighted average of 15.1%, a difference of 7.9%.
Poverty Correlation Summary
| Measurement | Sudanese | Immigrants from Cabo Verde |
| Minimum | 0.75% | 2.3% |
| Maximum | 40.5% | 32.5% |
| Range | 39.8% | 30.1% |
| Mean | 15.4% | 14.3% |
| Median | 13.4% | 13.7% |
| Interquartile 25% (IQ1) | 11.2% | 11.0% |
| Interquartile 75% (IQ3) | 17.8% | 17.6% |
| Interquartile Range (IQR) | 6.6% | 6.6% |
| Standard Deviation (Sample) | 7.9% | 6.6% |
| Standard Deviation (Population) | 7.8% | 6.5% |
Similar Demographics by Poverty
Demographics Similar to Sudanese by Poverty
In terms of poverty, the demographic groups most similar to Sudanese are Nepalese (14.0%, a difference of 0.030%), Ecuadorian (14.0%, a difference of 0.070%), Salvadoran (14.0%, a difference of 0.39%), Immigrants from Middle Africa (14.0%, a difference of 0.41%), and Immigrants from Sudan (14.1%, a difference of 0.42%).
| Demographics | Rating | Rank | Poverty |
| Immigrants | Armenia | 0.5 /100 | #236 | Tragic 13.9% |
| French American Indians | 0.5 /100 | #237 | Tragic 13.9% |
| Ghanaians | 0.5 /100 | #238 | Tragic 13.9% |
| Nicaraguans | 0.4 /100 | #239 | Tragic 13.9% |
| Immigrants | Middle Africa | 0.4 /100 | #240 | Tragic 14.0% |
| Salvadorans | 0.4 /100 | #241 | Tragic 14.0% |
| Ecuadorians | 0.4 /100 | #242 | Tragic 14.0% |
| Sudanese | 0.3 /100 | #243 | Tragic 14.0% |
| Nepalese | 0.3 /100 | #244 | Tragic 14.0% |
| Immigrants | Sudan | 0.3 /100 | #245 | Tragic 14.1% |
| Potawatomi | 0.3 /100 | #246 | Tragic 14.1% |
| Liberians | 0.2 /100 | #247 | Tragic 14.1% |
| Immigrants | Western Africa | 0.2 /100 | #248 | Tragic 14.1% |
| Immigrants | Ghana | 0.2 /100 | #249 | Tragic 14.2% |
| Cree | 0.2 /100 | #250 | Tragic 14.2% |
Demographics Similar to Immigrants from Cabo Verde by Poverty
In terms of poverty, the demographic groups most similar to Immigrants from Cabo Verde are Indonesian (15.1%, a difference of 0.050%), Immigrants from Zaire (15.1%, a difference of 0.060%), Mexican (15.1%, a difference of 0.13%), Immigrants from Belize (15.1%, a difference of 0.23%), and Yaqui (15.1%, a difference of 0.35%).
| Demographics | Rating | Rank | Poverty |
| West Indians | 0.0 /100 | #284 | Tragic 15.0% |
| Vietnamese | 0.0 /100 | #285 | Tragic 15.0% |
| Immigrants | Latin America | 0.0 /100 | #286 | Tragic 15.0% |
| Inupiat | 0.0 /100 | #287 | Tragic 15.1% |
| Yaqui | 0.0 /100 | #288 | Tragic 15.1% |
| Immigrants | Belize | 0.0 /100 | #289 | Tragic 15.1% |
| Mexicans | 0.0 /100 | #290 | Tragic 15.1% |
| Immigrants | Cabo Verde | 0.0 /100 | #291 | Tragic 15.1% |
| Indonesians | 0.0 /100 | #292 | Tragic 15.1% |
| Immigrants | Zaire | 0.0 /100 | #293 | Tragic 15.1% |
| Blackfeet | 0.0 /100 | #294 | Tragic 15.2% |
| Guatemalans | 0.0 /100 | #295 | Tragic 15.3% |
| Hispanics or Latinos | 0.0 /100 | #296 | Tragic 15.3% |
| Immigrants | Bangladesh | 0.0 /100 | #297 | Tragic 15.3% |
| Immigrants | Senegal | 0.0 /100 | #298 | Tragic 15.3% |