Chickasaw vs Immigrants from Cabo Verde Average Family Size
COMPARE
Chickasaw
Immigrants from Cabo Verde
Average Family Size
Average Family Size Comparison
Chickasaw
Immigrants from Cabo Verde
3.19
AVERAGE FAMILY SIZE
6.0/ 100
METRIC RATING
226th/ 347
METRIC RANK
3.20
AVERAGE FAMILY SIZE
16.0/ 100
METRIC RATING
206th/ 347
METRIC RANK
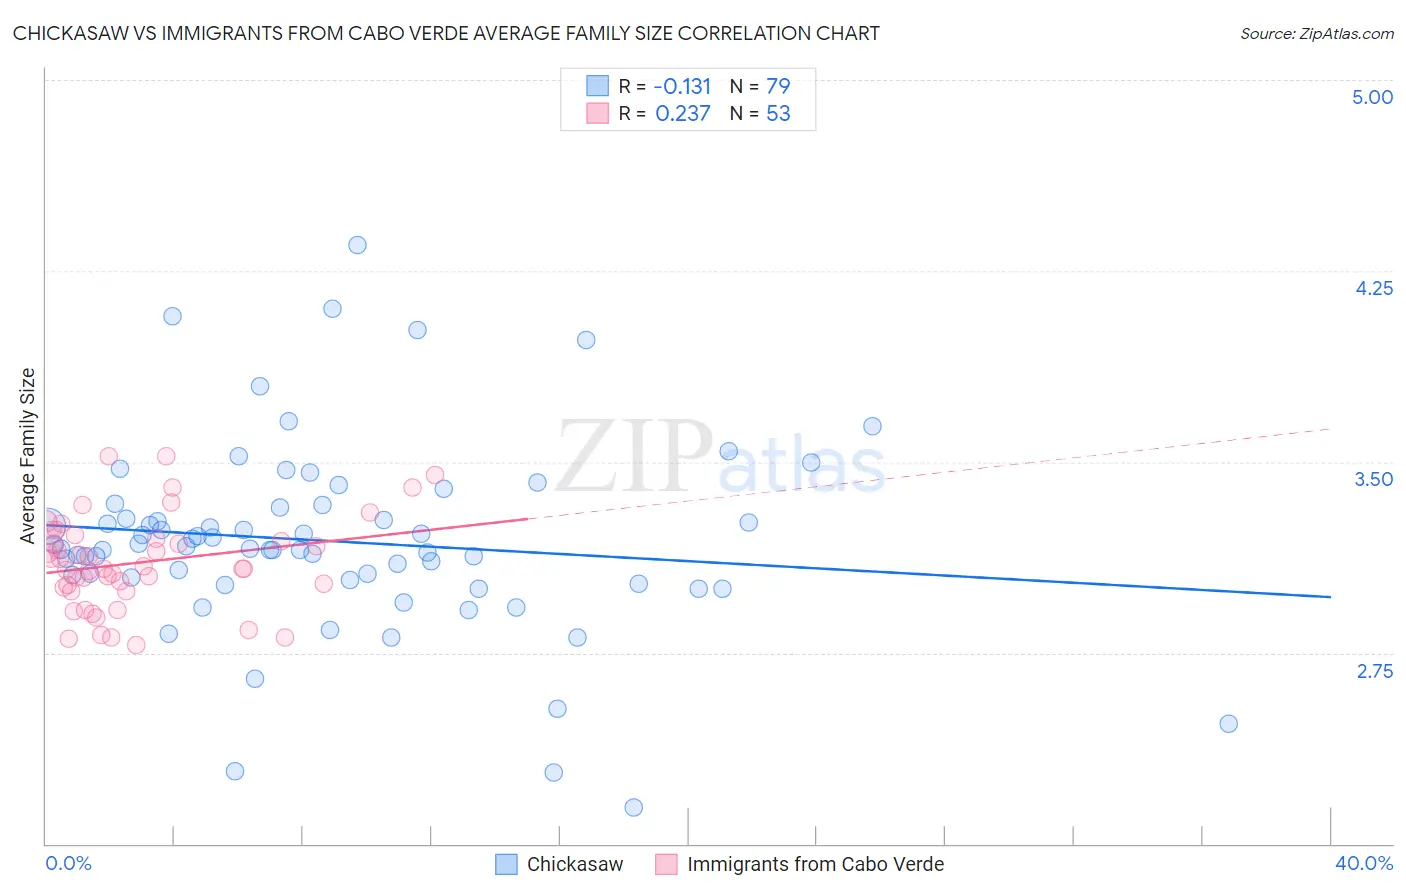
Chickasaw vs Immigrants from Cabo Verde Average Family Size Correlation Chart
The statistical analysis conducted on geographies consisting of 147,674,515 people shows a poor negative correlation between the proportion of Chickasaw and average family size in the United States with a correlation coefficient (R) of -0.131 and weighted average of 3.19. Similarly, the statistical analysis conducted on geographies consisting of 38,135,369 people shows a weak positive correlation between the proportion of Immigrants from Cabo Verde and average family size in the United States with a correlation coefficient (R) of 0.237 and weighted average of 3.20, a difference of 0.50%.
Average Family Size Correlation Summary
| Measurement | Chickasaw | Immigrants from Cabo Verde |
| Minimum | 2.14 | 2.78 |
| Maximum | 4.35 | 3.52 |
| Range | 2.21 | 0.74 |
| Mean | 3.19 | 3.10 |
| Median | 3.16 | 3.08 |
| Interquartile 25% (IQ1) | 3.04 | 3.00 |
| Interquartile 75% (IQ3) | 3.32 | 3.21 |
| Interquartile Range (IQR) | 0.28 | 0.21 |
| Standard Deviation (Sample) | 0.38 | 0.18 |
| Standard Deviation (Population) | 0.37 | 0.18 |
Demographics Similar to Chickasaw and Immigrants from Cabo Verde by Average Family Size
In terms of average family size, the demographic groups most similar to Chickasaw are Cree (3.19, a difference of 0.020%), Syrian (3.19, a difference of 0.040%), Immigrants from Zimbabwe (3.19, a difference of 0.080%), Immigrants from Ukraine (3.19, a difference of 0.090%), and Immigrants from Kuwait (3.19, a difference of 0.090%). Similarly, the demographic groups most similar to Immigrants from Cabo Verde are Filipino (3.20, a difference of 0.090%), Chippewa (3.20, a difference of 0.10%), Sudanese (3.20, a difference of 0.10%), Zimbabwean (3.20, a difference of 0.13%), and Immigrants from Iran (3.20, a difference of 0.15%).
| Demographics | Rating | Rank | Average Family Size |
| Immigrants | Cabo Verde | 16.0 /100 | #206 | Poor 3.20 |
| Filipinos | 13.6 /100 | #207 | Poor 3.20 |
| Chippewa | 13.3 /100 | #208 | Poor 3.20 |
| Sudanese | 13.3 /100 | #209 | Poor 3.20 |
| Zimbabweans | 12.6 /100 | #210 | Poor 3.20 |
| Immigrants | Iran | 12.1 /100 | #211 | Poor 3.20 |
| Creek | 12.1 /100 | #212 | Poor 3.20 |
| Mongolians | 11.5 /100 | #213 | Poor 3.20 |
| Somalis | 11.2 /100 | #214 | Poor 3.20 |
| Delaware | 11.1 /100 | #215 | Poor 3.20 |
| Bermudans | 11.0 /100 | #216 | Poor 3.20 |
| Immigrants | Somalia | 10.3 /100 | #217 | Poor 3.20 |
| French American Indians | 9.8 /100 | #218 | Tragic 3.20 |
| Pennsylvania Germans | 9.3 /100 | #219 | Tragic 3.19 |
| Lebanese | 9.1 /100 | #220 | Tragic 3.19 |
| Immigrants | Ukraine | 7.2 /100 | #221 | Tragic 3.19 |
| Immigrants | Kuwait | 7.2 /100 | #222 | Tragic 3.19 |
| Immigrants | Zimbabwe | 7.1 /100 | #223 | Tragic 3.19 |
| Syrians | 6.5 /100 | #224 | Tragic 3.19 |
| Cree | 6.2 /100 | #225 | Tragic 3.19 |
| Chickasaw | 6.0 /100 | #226 | Tragic 3.19 |