Zip Codes with the Highest Percentage of Population Employed in Accommodation & Food Services in Allentown, PA
RELATED REPORTS & OPTIONS
Accommodation & Food Services
Allentown
Compare Zip Codes
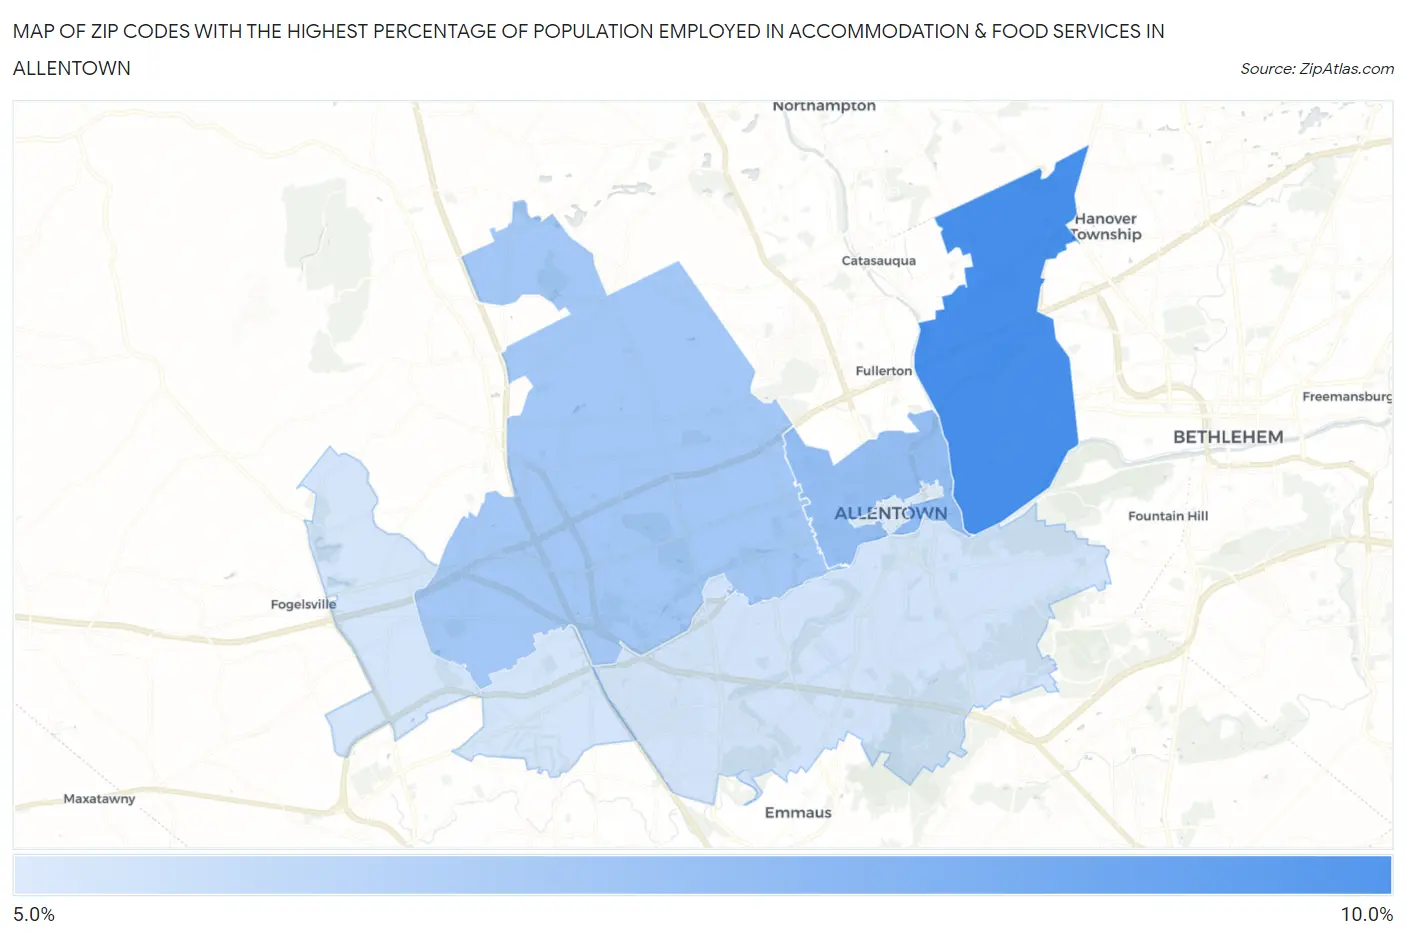
Map of Zip Codes with the Highest Percentage of Population Employed in Accommodation & Food Services in Allentown
5.7%
9.9%
Zip Codes with the Highest Percentage of Population Employed in Accommodation & Food Services in Allentown, PA
| Zip Code | % Employed | vs State | vs National | |
| 1. | 18109 | 9.9% | 5.9%(+3.96)#213 | 6.9%(+2.97)#4,721 |
| 2. | 18102 | 7.7% | 5.9%(+1.84)#372 | 6.9%(+0.846)#8,423 |
| 3. | 18104 | 7.2% | 5.9%(+1.34)#441 | 6.9%(+0.345)#9,732 |
| 4. | 18103 | 6.0% | 5.9%(+0.095)#654 | 6.9%(-0.896)#13,495 |
| 5. | 18106 | 5.9% | 5.9%(+0.005)#672 | 6.9%(-0.987)#13,792 |
| 6. | 18101 | 5.7% | 5.9%(-0.234)#724 | 6.9%(-1.23)#14,529 |
1
Common Questions
What are the Top 5 Zip Codes with the Highest Percentage of Population Employed in Accommodation & Food Services in Allentown, PA?
Top 5 Zip Codes with the Highest Percentage of Population Employed in Accommodation & Food Services in Allentown, PA are:
What zip code has the Highest Percentage of Population Employed in Accommodation & Food Services in Allentown, PA?
18109 has the Highest Percentage of Population Employed in Accommodation & Food Services in Allentown, PA with 9.9%.
What is the Percentage of Population Employed in Accommodation & Food Services in Allentown, PA?
Percentage of Population Employed in Accommodation & Food Services in Allentown is 7.9%.
What is the Percentage of Population Employed in Accommodation & Food Services in Pennsylvania?
Percentage of Population Employed in Accommodation & Food Services in Pennsylvania is 5.9%.
What is the Percentage of Population Employed in Accommodation & Food Services in the United States?
Percentage of Population Employed in Accommodation & Food Services in the United States is 6.9%.