Zip Codes with the Highest Percentage of Population Employed in Health Diagnosing & Treating in Laurel, MD
RELATED REPORTS & OPTIONS
Health Diagnosing & Treating
Laurel
Compare Zip Codes
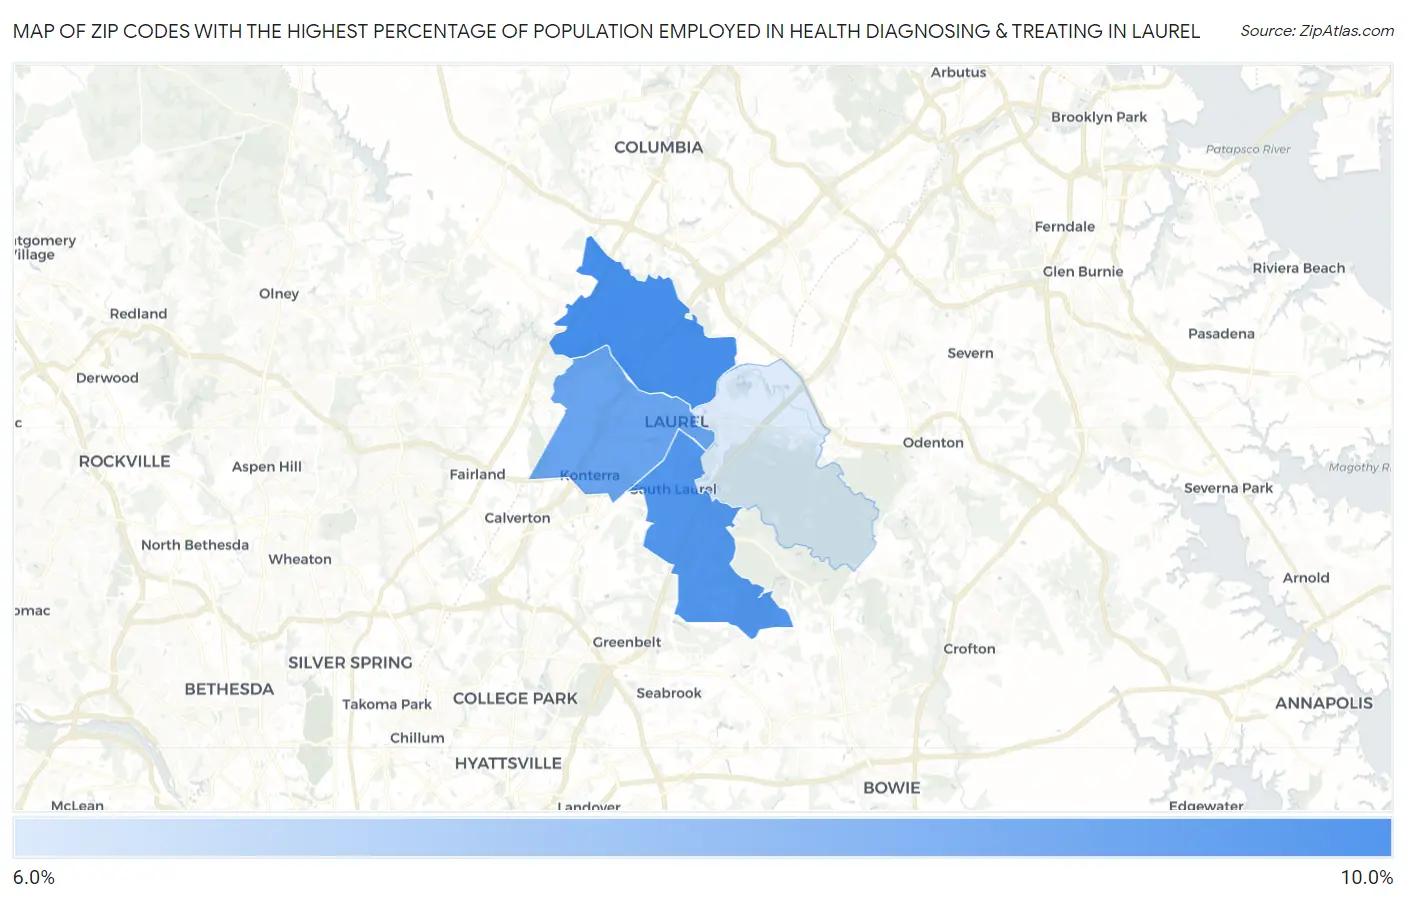
Map of Zip Codes with the Highest Percentage of Population Employed in Health Diagnosing & Treating in Laurel
6.5%
8.2%
Zip Codes with the Highest Percentage of Population Employed in Health Diagnosing & Treating in Laurel, MD
| Zip Code | % Employed | vs State | vs National | |
| 1. | 20723 | 8.2% | 6.2%(+1.97)#112 | 6.2%(+1.93)#7,066 |
| 2. | 20708 | 8.0% | 6.2%(+1.83)#114 | 6.2%(+1.79)#7,400 |
| 3. | 20707 | 7.8% | 6.2%(+1.56)#123 | 6.2%(+1.52)#8,069 |
| 4. | 20724 | 6.5% | 6.2%(+0.255)#180 | 6.2%(+0.217)#12,159 |
1
Common Questions
What are the Top 3 Zip Codes with the Highest Percentage of Population Employed in Health Diagnosing & Treating in Laurel, MD?
Top 3 Zip Codes with the Highest Percentage of Population Employed in Health Diagnosing & Treating in Laurel, MD are:
What zip code has the Highest Percentage of Population Employed in Health Diagnosing & Treating in Laurel, MD?
20723 has the Highest Percentage of Population Employed in Health Diagnosing & Treating in Laurel, MD with 8.2%.
What is the Percentage of Population Employed in Health Diagnosing & Treating in Laurel, MD?
Percentage of Population Employed in Health Diagnosing & Treating in Laurel is 7.6%.
What is the Percentage of Population Employed in Health Diagnosing & Treating in Maryland?
Percentage of Population Employed in Health Diagnosing & Treating in Maryland is 6.2%.
What is the Percentage of Population Employed in Health Diagnosing & Treating in the United States?
Percentage of Population Employed in Health Diagnosing & Treating in the United States is 6.2%.