Zip Codes with the Highest Percentage of Population Employed in Arts, Media & Entertainment in Denham Springs, LA
RELATED REPORTS & OPTIONS
Arts, Media & Entertainment
Denham Springs
Compare Zip Codes
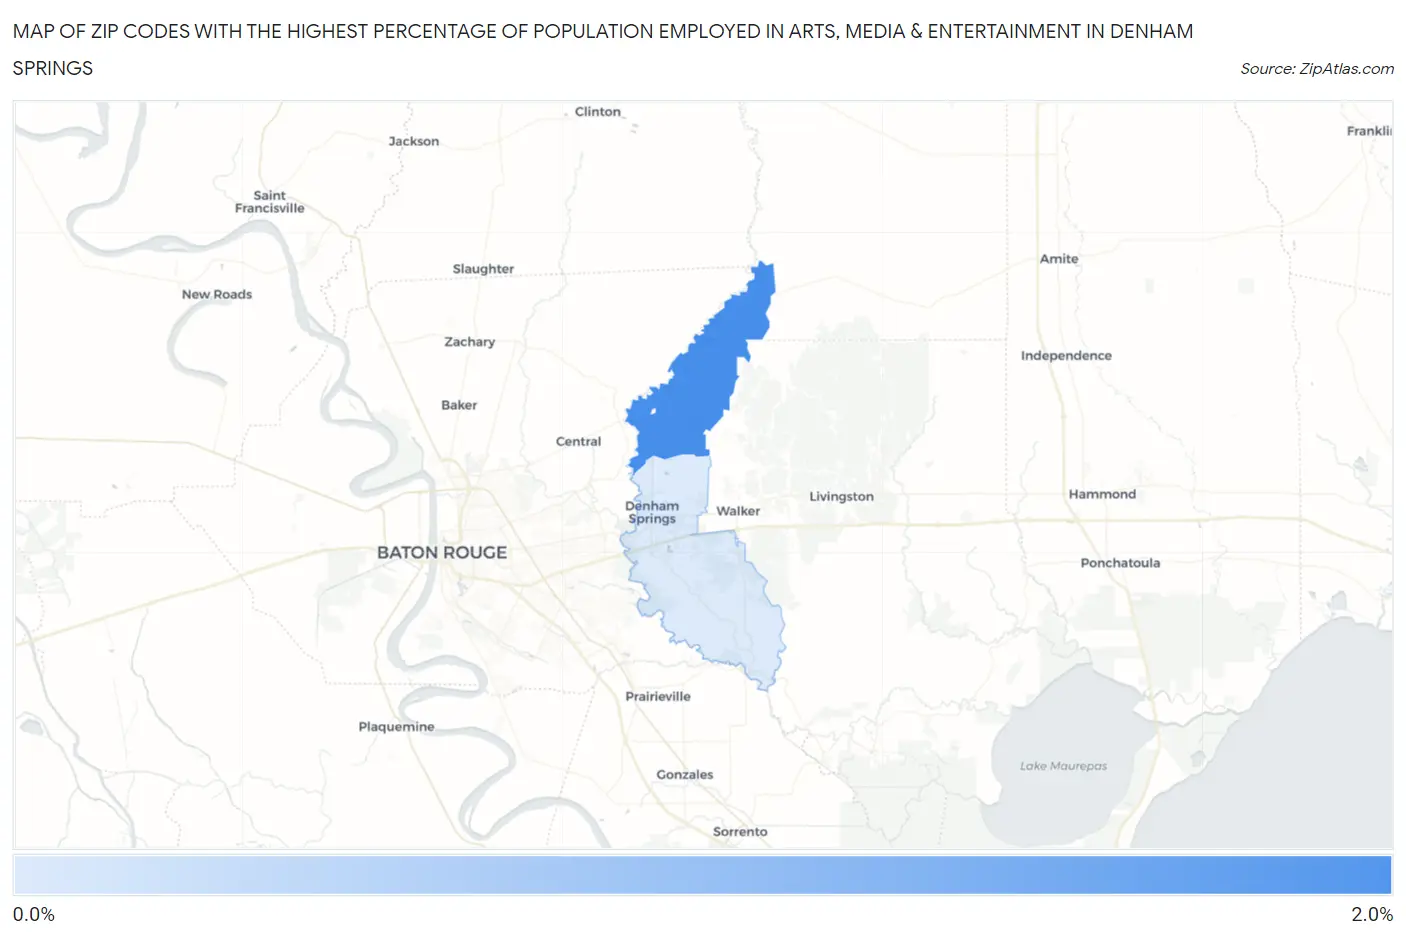
Map of Zip Codes with the Highest Percentage of Population Employed in Arts, Media & Entertainment in Denham Springs
0.80%
1.8%
Zip Codes with the Highest Percentage of Population Employed in Arts, Media & Entertainment in Denham Springs, LA
| Zip Code | % Employed | vs State | vs National | |
| 1. | 70706 | 1.8% | 1.6%(+0.205)#92 | 2.1%(-0.304)#9,225 |
| 2. | 70726 | 0.80% | 1.6%(-0.757)#194 | 2.1%(-1.27)#16,462 |
1
Common Questions
What are the Top Zip Codes with the Highest Percentage of Population Employed in Arts, Media & Entertainment in Denham Springs, LA?
Top Zip Codes with the Highest Percentage of Population Employed in Arts, Media & Entertainment in Denham Springs, LA are:
What zip code has the Highest Percentage of Population Employed in Arts, Media & Entertainment in Denham Springs, LA?
70706 has the Highest Percentage of Population Employed in Arts, Media & Entertainment in Denham Springs, LA with 1.8%.
What is the Percentage of Population Employed in Arts, Media & Entertainment in Denham Springs, LA?
Percentage of Population Employed in Arts, Media & Entertainment in Denham Springs is 0.37%.
What is the Percentage of Population Employed in Arts, Media & Entertainment in Louisiana?
Percentage of Population Employed in Arts, Media & Entertainment in Louisiana is 1.6%.
What is the Percentage of Population Employed in Arts, Media & Entertainment in the United States?
Percentage of Population Employed in Arts, Media & Entertainment in the United States is 2.1%.