Zip Codes with the Highest Percentage of Population Employed in Sales & Related in Denham Springs, LA
RELATED REPORTS & OPTIONS
Sales & Related
Denham Springs
Compare Zip Codes
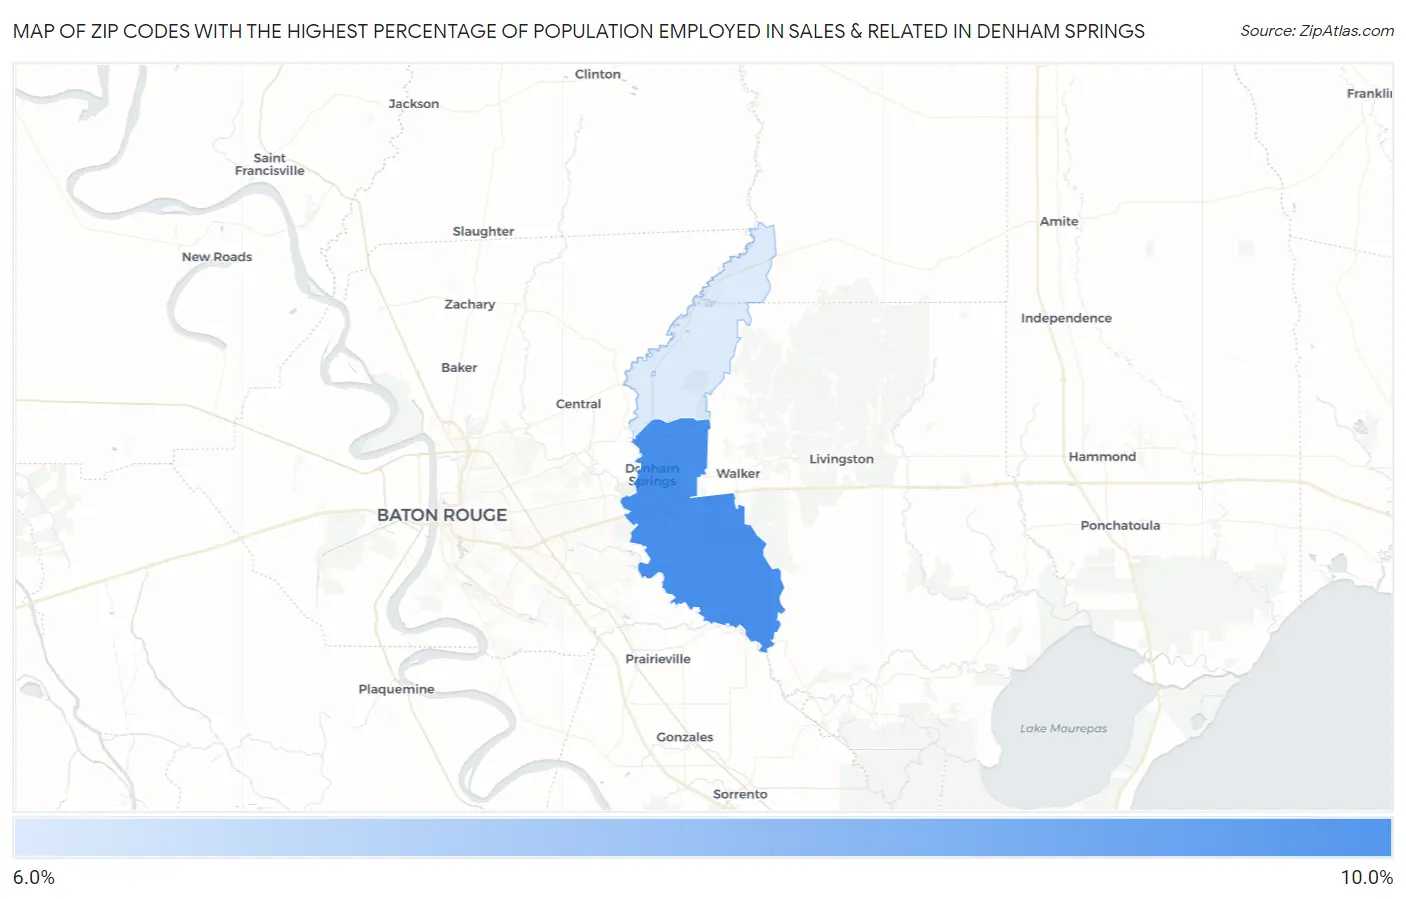
Map of Zip Codes with the Highest Percentage of Population Employed in Sales & Related in Denham Springs
6.8%
10.0%
Zip Codes with the Highest Percentage of Population Employed in Sales & Related in Denham Springs, LA
| Zip Code | % Employed | vs State | vs National | |
| 1. | 70726 | 10.0% | 10.2%(-0.264)#214 | 9.6%(+0.359)#11,158 |
| 2. | 70706 | 6.8% | 10.2%(-3.42)#352 | 9.6%(-2.80)#21,735 |
1
Common Questions
What are the Top Zip Codes with the Highest Percentage of Population Employed in Sales & Related in Denham Springs, LA?
Top Zip Codes with the Highest Percentage of Population Employed in Sales & Related in Denham Springs, LA are:
What zip code has the Highest Percentage of Population Employed in Sales & Related in Denham Springs, LA?
70726 has the Highest Percentage of Population Employed in Sales & Related in Denham Springs, LA with 10.0%.
What is the Percentage of Population Employed in Sales & Related in Denham Springs, LA?
Percentage of Population Employed in Sales & Related in Denham Springs is 7.5%.
What is the Percentage of Population Employed in Sales & Related in Louisiana?
Percentage of Population Employed in Sales & Related in Louisiana is 10.2%.
What is the Percentage of Population Employed in Sales & Related in the United States?
Percentage of Population Employed in Sales & Related in the United States is 9.6%.