Zip Codes with the Largest Hispanic or Latino Community in Denham Springs, LA
RELATED REPORTS & OPTIONS
Hispanic or Latino
Denham Springs
Compare Zip Codes
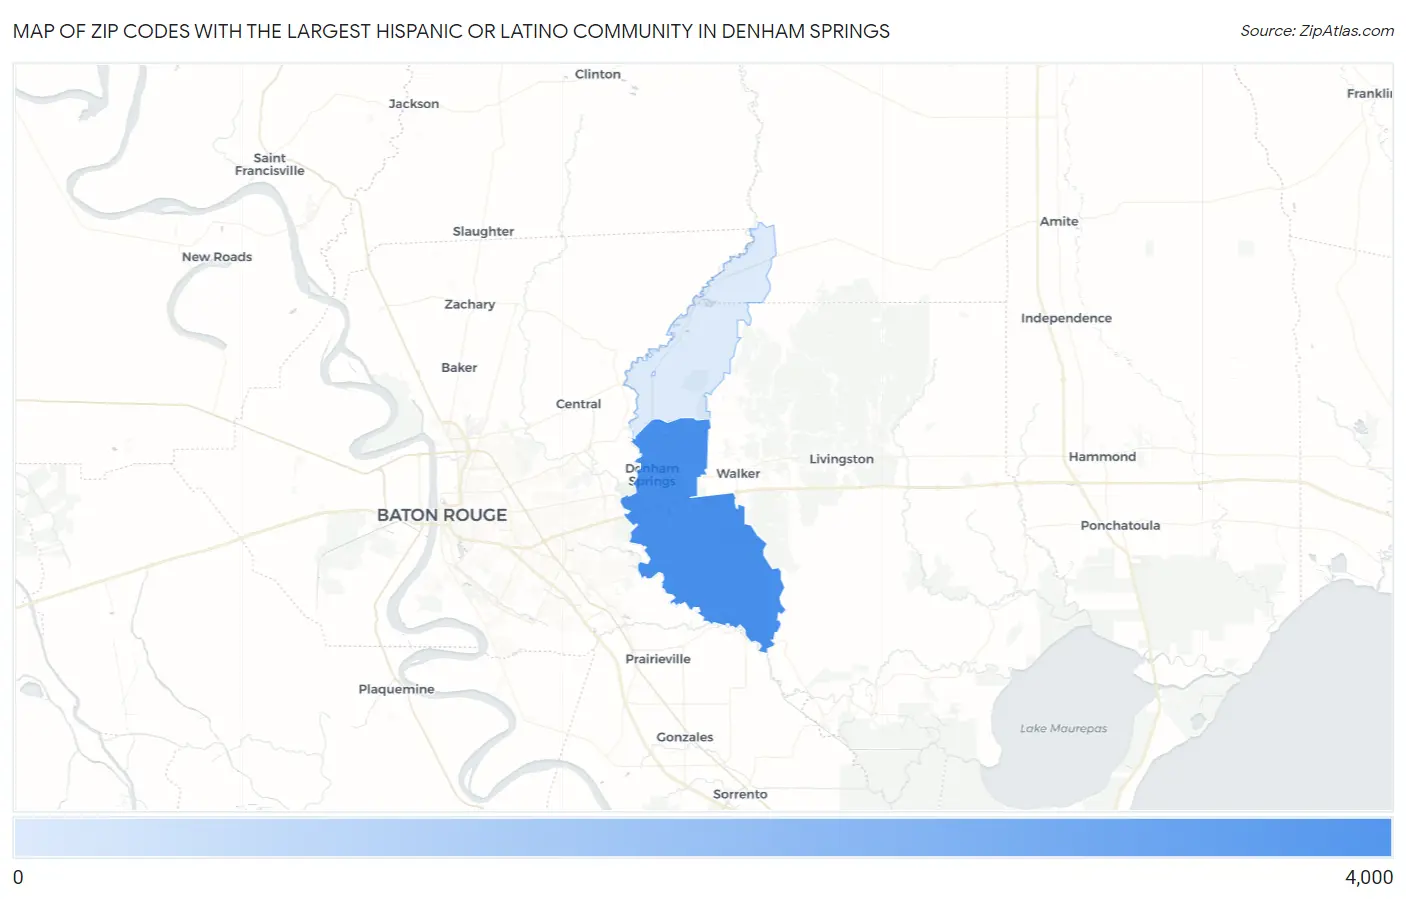
Map of Zip Codes with the Largest Hispanic or Latino Community in Denham Springs
806
3,754
Zip Codes with the Largest Hispanic or Latino Community in Denham Springs, LA
| Zip Code | Hispanic or Latino | vs State | vs National | |
| 1. | 70726 | 3,754 | 255,584(1.47%)#11 | 61,755,866(0.01%)#3,908 |
| 2. | 70706 | 806 | 255,584(0.32%)#92 | 61,755,866(0.00%)#8,974 |
1
Common Questions
What are the Top Zip Codes with the Largest Hispanic or Latino Community in Denham Springs, LA?
Top Zip Codes with the Largest Hispanic or Latino Community in Denham Springs, LA are:
What zip code has the Largest Hispanic or Latino Community in Denham Springs, LA?
70726 has the Largest Hispanic or Latino Community in Denham Springs, LA with 3,754.
What is the Total Hispanic or Latino Population in Denham Springs, LA?
Total Hispanic or Latino Population in Denham Springs is 872.
What is the Total Hispanic or Latino Population in Louisiana?
Total Hispanic or Latino Population in Louisiana is 255,584.
What is the Total Hispanic or Latino Population in the United States?
Total Hispanic or Latino Population in the United States is 61,755,866.