Zip Codes with the Highest Percentage of Population Employed in Arts, Entertainment & Recreation in Denham Springs, LA
RELATED REPORTS & OPTIONS
Arts, Entertainment & Recreation
Denham Springs
Compare Zip Codes
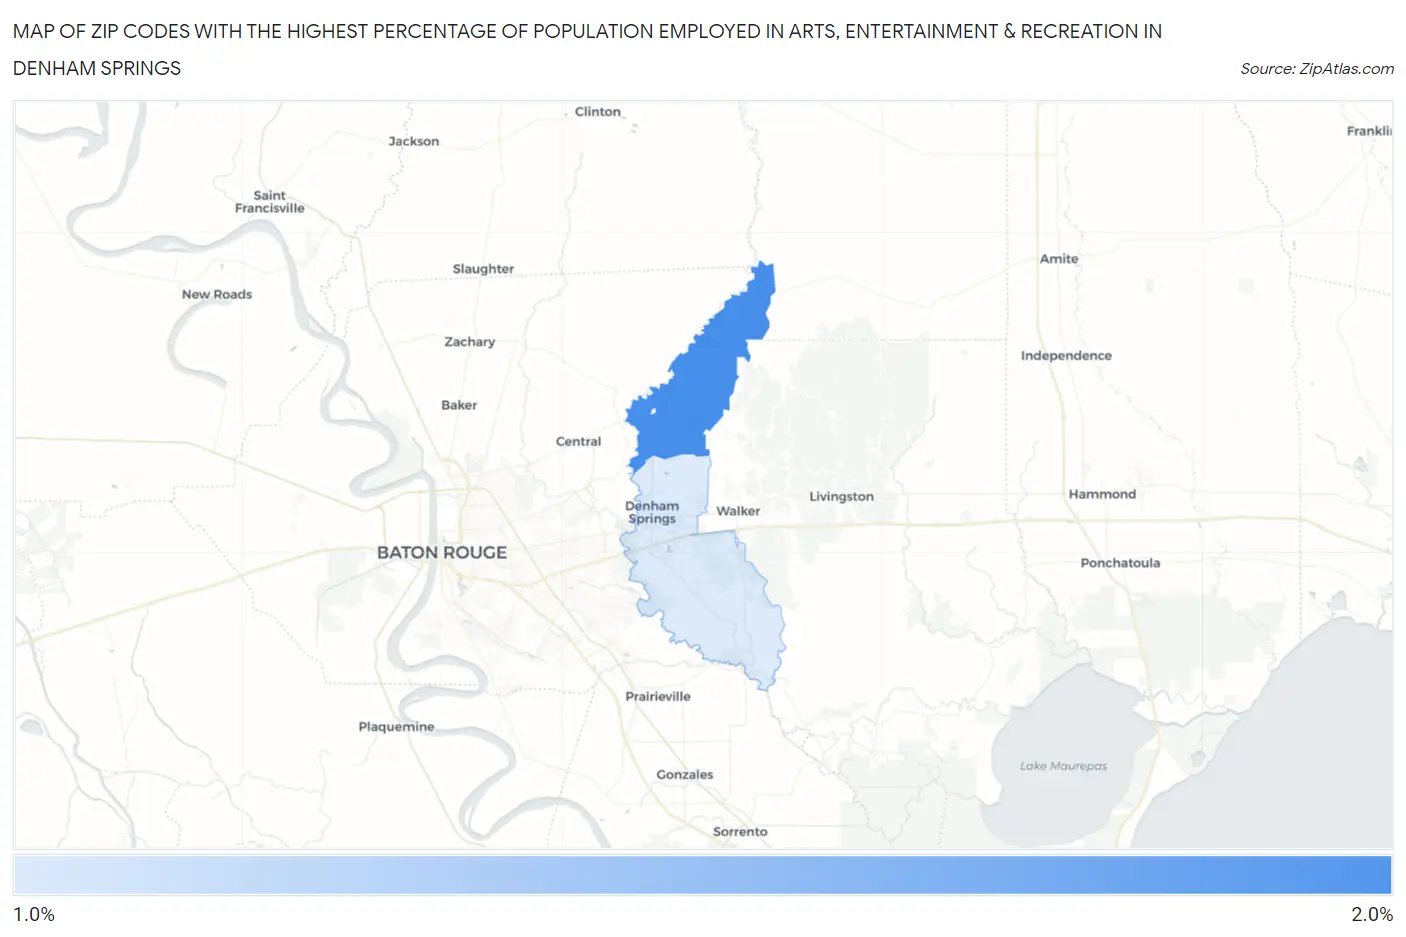
Map of Zip Codes with the Highest Percentage of Population Employed in Arts, Entertainment & Recreation in Denham Springs
1.1%
1.6%
Zip Codes with the Highest Percentage of Population Employed in Arts, Entertainment & Recreation in Denham Springs, LA
| Zip Code | % Employed | vs State | vs National | |
| 1. | 70706 | 1.6% | 2.2%(-0.628)#202 | 2.1%(-0.513)#12,707 |
| 2. | 70726 | 1.1% | 2.2%(-1.11)#249 | 2.1%(-0.995)#16,333 |
1
Common Questions
What are the Top Zip Codes with the Highest Percentage of Population Employed in Arts, Entertainment & Recreation in Denham Springs, LA?
Top Zip Codes with the Highest Percentage of Population Employed in Arts, Entertainment & Recreation in Denham Springs, LA are:
What zip code has the Highest Percentage of Population Employed in Arts, Entertainment & Recreation in Denham Springs, LA?
70706 has the Highest Percentage of Population Employed in Arts, Entertainment & Recreation in Denham Springs, LA with 1.6%.
What is the Percentage of Population Employed in Arts, Entertainment & Recreation in Denham Springs, LA?
Percentage of Population Employed in Arts, Entertainment & Recreation in Denham Springs is 0.37%.
What is the Percentage of Population Employed in Arts, Entertainment & Recreation in Louisiana?
Percentage of Population Employed in Arts, Entertainment & Recreation in Louisiana is 2.2%.
What is the Percentage of Population Employed in Arts, Entertainment & Recreation in the United States?
Percentage of Population Employed in Arts, Entertainment & Recreation in the United States is 2.1%.