Zip Codes with the Highest Percentage of Households with Income Above $100,000 in Denham Springs, LA
RELATED REPORTS & OPTIONS
Household Income | $100k+
Denham Springs
Compare Zip Codes
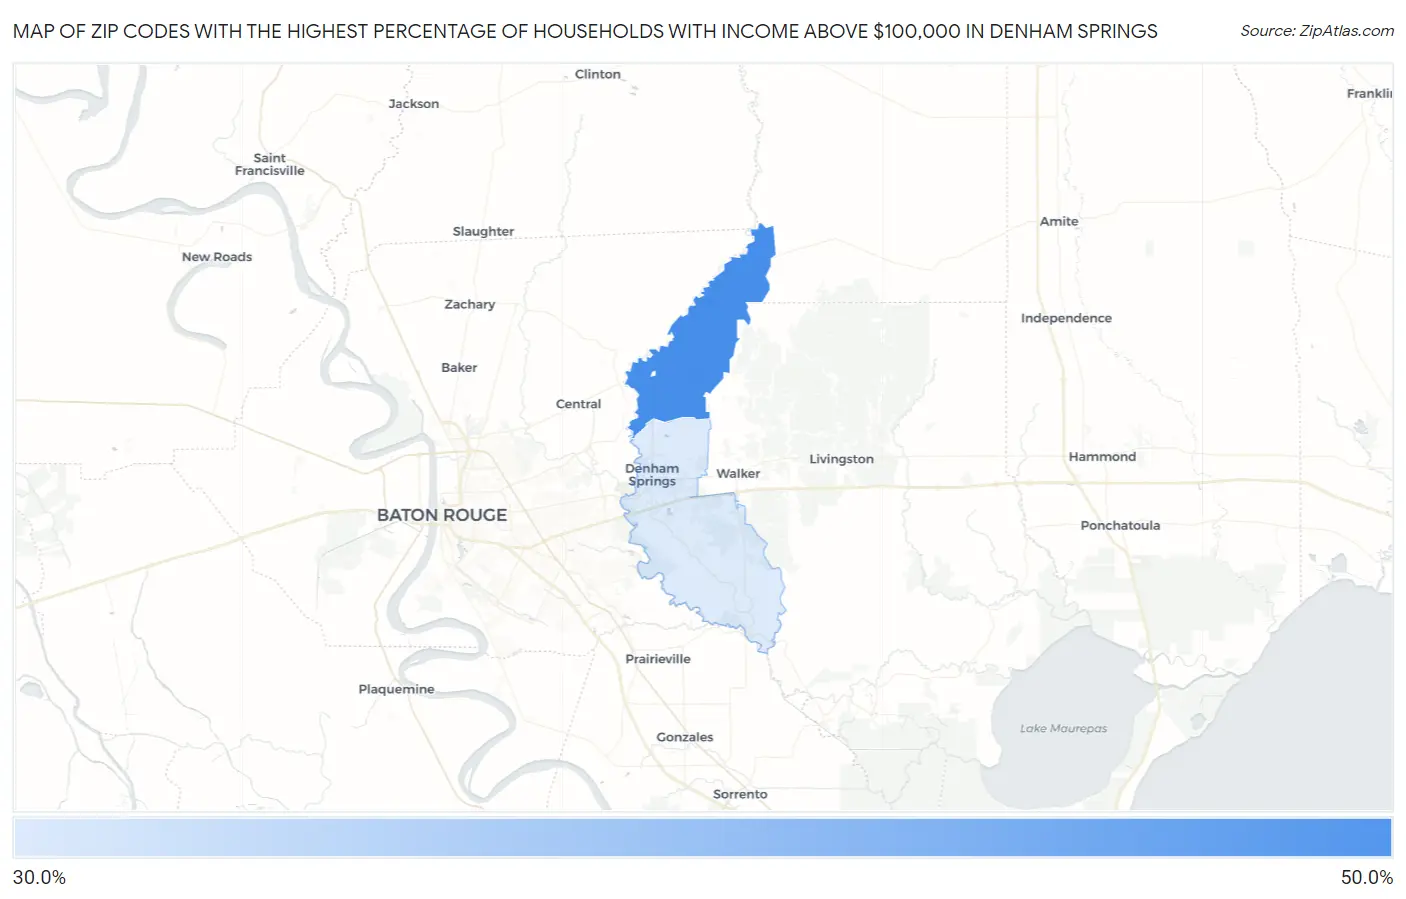
Map of Zip Codes with the Highest Percentage of Households with Income Above $100,000 in Denham Springs
38.0%
46.9%
Zip Codes with the Highest Percentage of Households with Income Above $100,000 in Denham Springs, LA
| Zip Code | Households with Income > $100k | vs State | vs National | |
| 1. | 70706 | 46.9% | 28.2%(+18.7)#37 | 37.3%(+9.60)#5,858 |
| 2. | 70726 | 38.0% | 28.2%(+9.80)#83 | 37.3%(+0.700)#9,973 |
1
Common Questions
What are the Top Zip Codes with the Highest Percentage of Households with Income Above $100,000 in Denham Springs, LA?
Top Zip Codes with the Highest Percentage of Households with Income Above $100,000 in Denham Springs, LA are:
What zip code has the Highest Percentage of Households with Income Above $100,000 in Denham Springs, LA?
70706 has the Highest Percentage of Households with Income Above $100,000 in Denham Springs, LA with 46.9%.
What is the Percentage of Households with Income Above $100,000 in Denham Springs, LA?
Percentage of Households with Income Above $100,000 in Denham Springs is 41.5%.
What is the Percentage of Households with Income Above $100,000 in Louisiana?
Percentage of Households with Income Above $100,000 in Louisiana is 28.2%.
What is the Percentage of Households with Income Above $100,000 in the United States?
Percentage of Households with Income Above $100,000 in the United States is 37.3%.