Zip Codes with the Most Immigrants from South America in Denham Springs, LA
RELATED REPORTS & OPTIONS
South America
Denham Springs
Compare Zip Codes
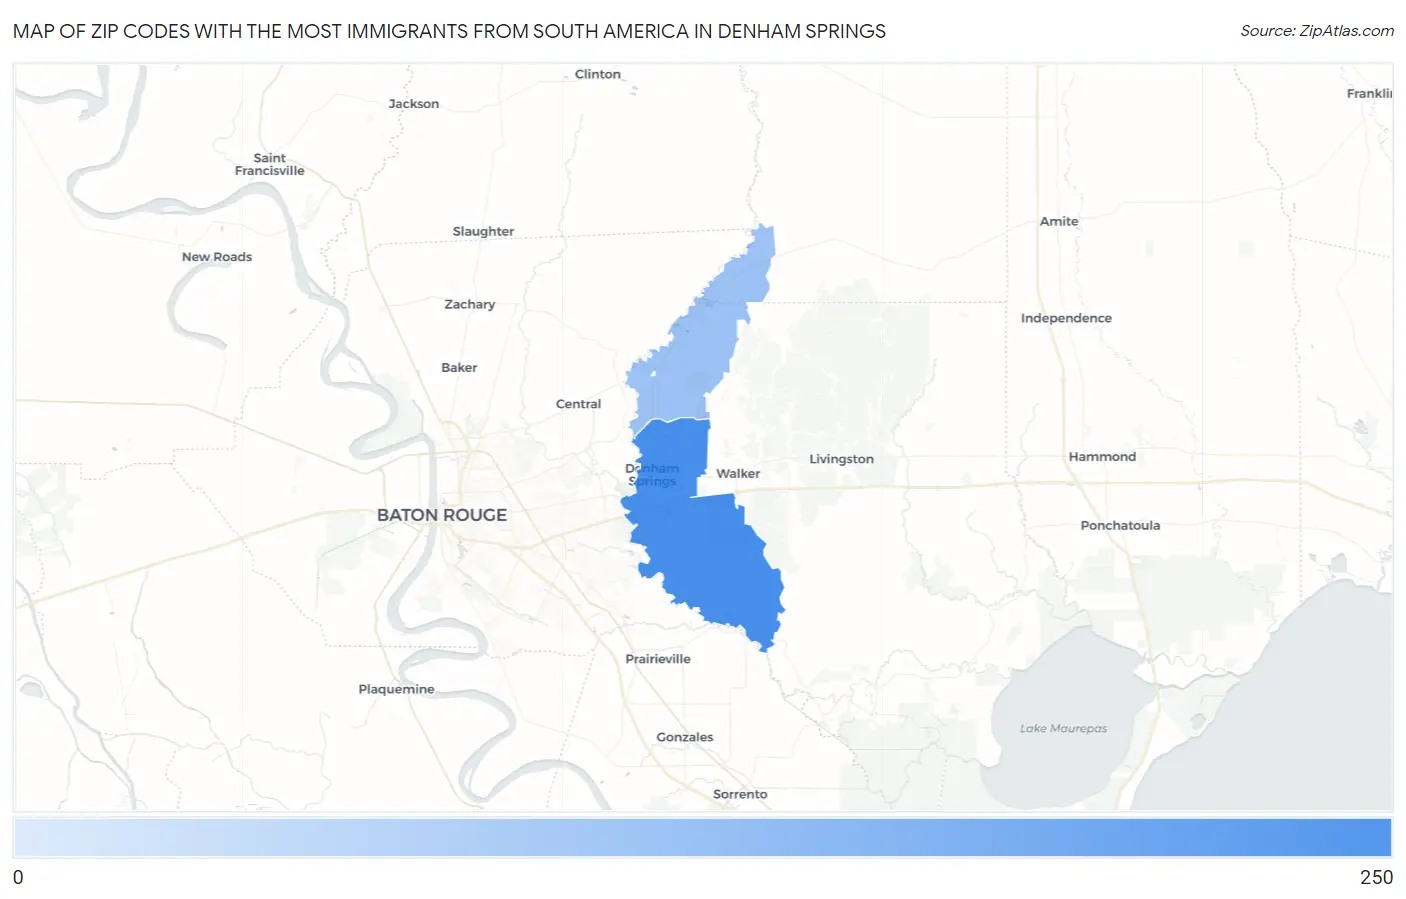
Map of Zip Codes with the Most Immigrants from South America in Denham Springs
10
212
Zip Codes with the Most Immigrants from South America in Denham Springs, LA
| Zip Code | South America | vs State | vs National | |
| 1. | 70726 | 212 | 10,085(2.10%)#11 | 3,636,375(0.01%)#3,216 |
| 2. | 70706 | 10 | 10,085(0.10%)#118 | 3,636,375(0.00%)#10,243 |
1
Common Questions
What are the Top Zip Codes with the Most Immigrants from South America in Denham Springs, LA?
Top Zip Codes with the Most Immigrants from South America in Denham Springs, LA are:
What zip code has the Most Immigrants from South America in Denham Springs, LA?
70726 has the Most Immigrants from South America in Denham Springs, LA with 212.
What is the Total Immigrants from South America in Denham Springs, LA?
Total Immigrants from South America in Denham Springs is 170.
What is the Total Immigrants from South America in Louisiana?
Total Immigrants from South America in Louisiana is 10,085.
What is the Total Immigrants from South America in the United States?
Total Immigrants from South America in the United States is 3,636,375.